
Welcome to the fourth quarter – the final stretch of the year! Things have certainly moved on since my original post (both in terms of market movements and the general consensus/sentiment). So I thought it would be helpful to take a quick progress check on the “10 Charts to Watch in 2021“.
Q3 2021 hedge fund letters, conferences and more
In the original article I shared what I thought would be the 10 most important charts to watch for multi-asset investors in the year ahead (and beyond).
In this article I have updated those 10 charts, and provided some updated comments.
I thought you might find it interesting because it’s basically a macro/multi-asset Chart Storm!
[Note: I have included the original comments from back at the start of the year, so you can quickly compare what I’m thinking now vs what I said back then]
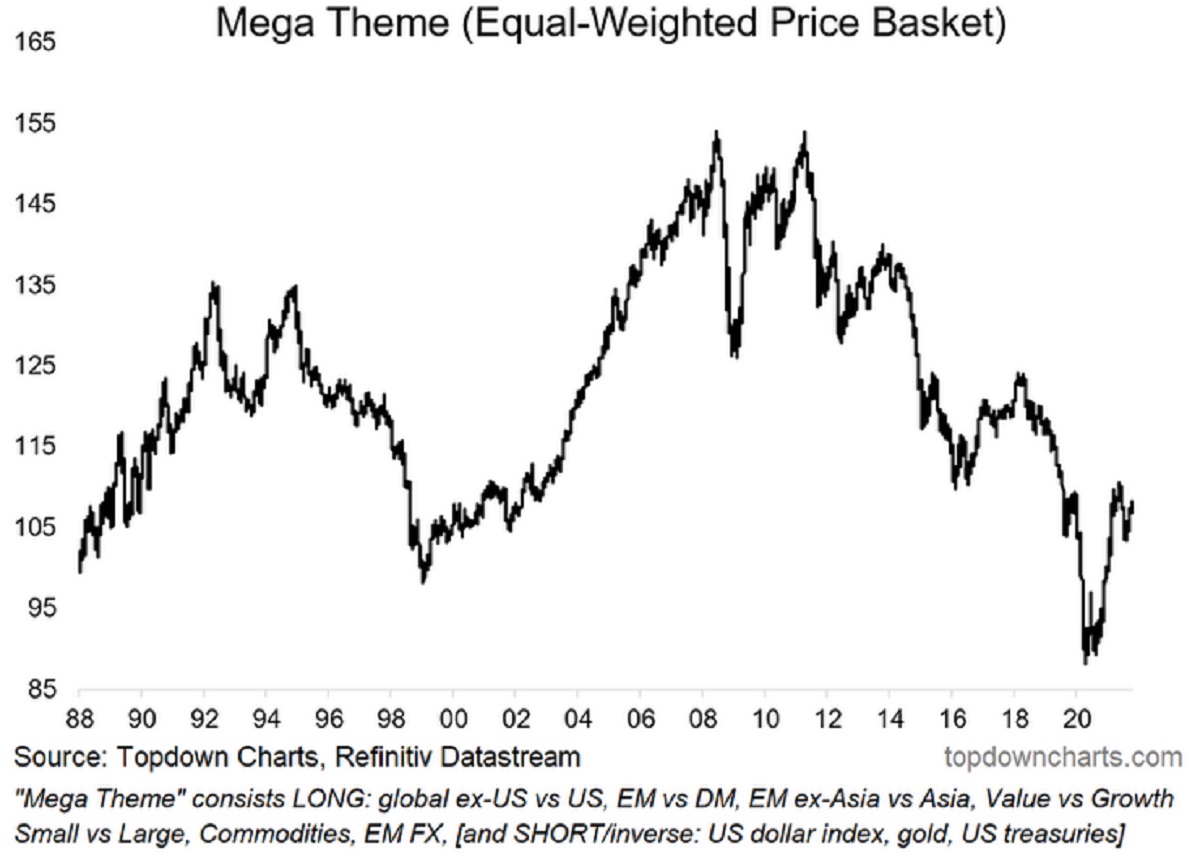
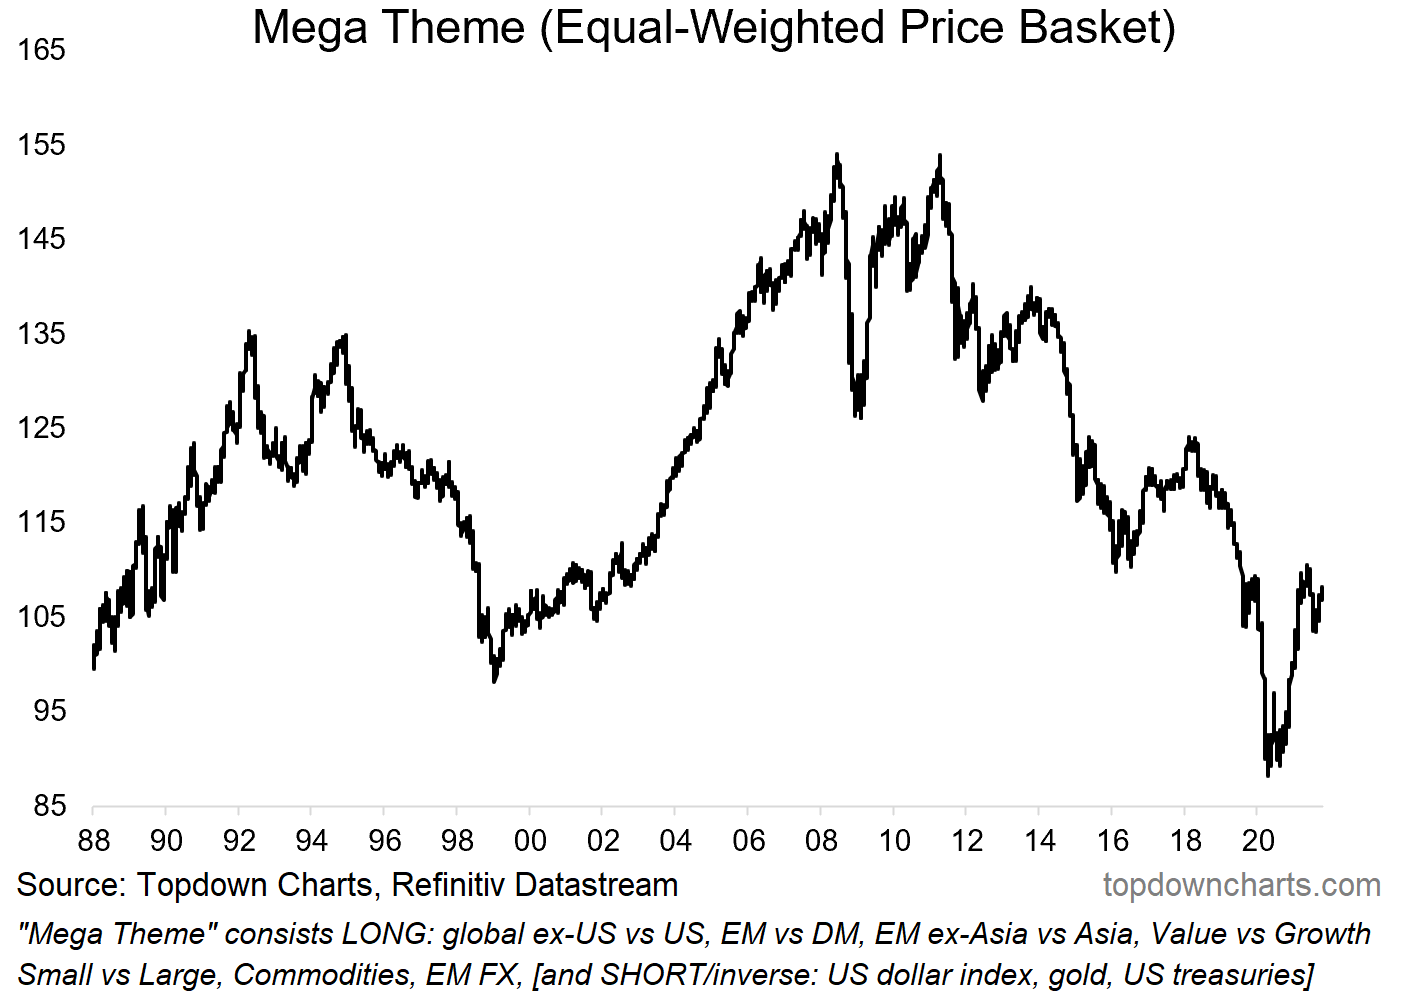
1. Mega Theme: This rather interesting and diverse basket of ideas initially had a very strong run, but for a variety of reasons took a bit of a breather (e.g. sentiment was probably a bit over-cooked on a few of them, and delta resurgence injected a bit of volatility, uncertainty, and reversed a few emergent market trends). But with covid tapering, Fed tapering, and a good washout in sentiment (e.g. some of the consensus themes at the start of the year have either been forgotten or fallen completely out of favor), things seem to be back on track. I am still basically happy with all of the ideas – albeit I currently still have EM on risk watch [pending the all-clear in the key risk indicators].
Back at the start of the year I said: “In the last regular edition of the Weekly Macro Themes report of 2020, I decided to combine all my big ideas into one “mega theme” given some of the echoes across the ideas in terms of price action and macro drivers. The result is this interesting chart which looks to be either at or near the bottom of a long-term secular trend, and the start of at least a short-term cyclical upturn.”
2. Monetary Policy (limits): Lending standards are quickly being relaxed as glimmers of greater certainty and at least better economic conditions are driving banks to look for growth. This comes as policy is turning the corner and rates are steadily starting to rise across the globe. There are a few echoes of the post-financial crisis period (2009-12) in this chart, and I think this adds up to a window of easy credit conditions and low borrowing costs (at least before central bankers are dragged into hiking rates further/faster): this should be supportive of the much needed capital expenditure that arguably a lot of sectors are overdue to execute (e.g. commodities, shipping), not to mention green energy and infrastructure investment.
“The policy response to the pandemic was historic in terms of its speed, magnitude, and coordination across countries and between fiscal and monetary. But this chart perhaps highlights one limitation of monetary policy, the tag line is “interest rates are low, but good luck getting a loan” (given how much banks tightened up on lending standards). One thing on my mind is a possible passing of the torch from monetary policy to fiscal policy – as that’s going to be the thing that will achieve a more balanced and more transformative impact in the recovery.”

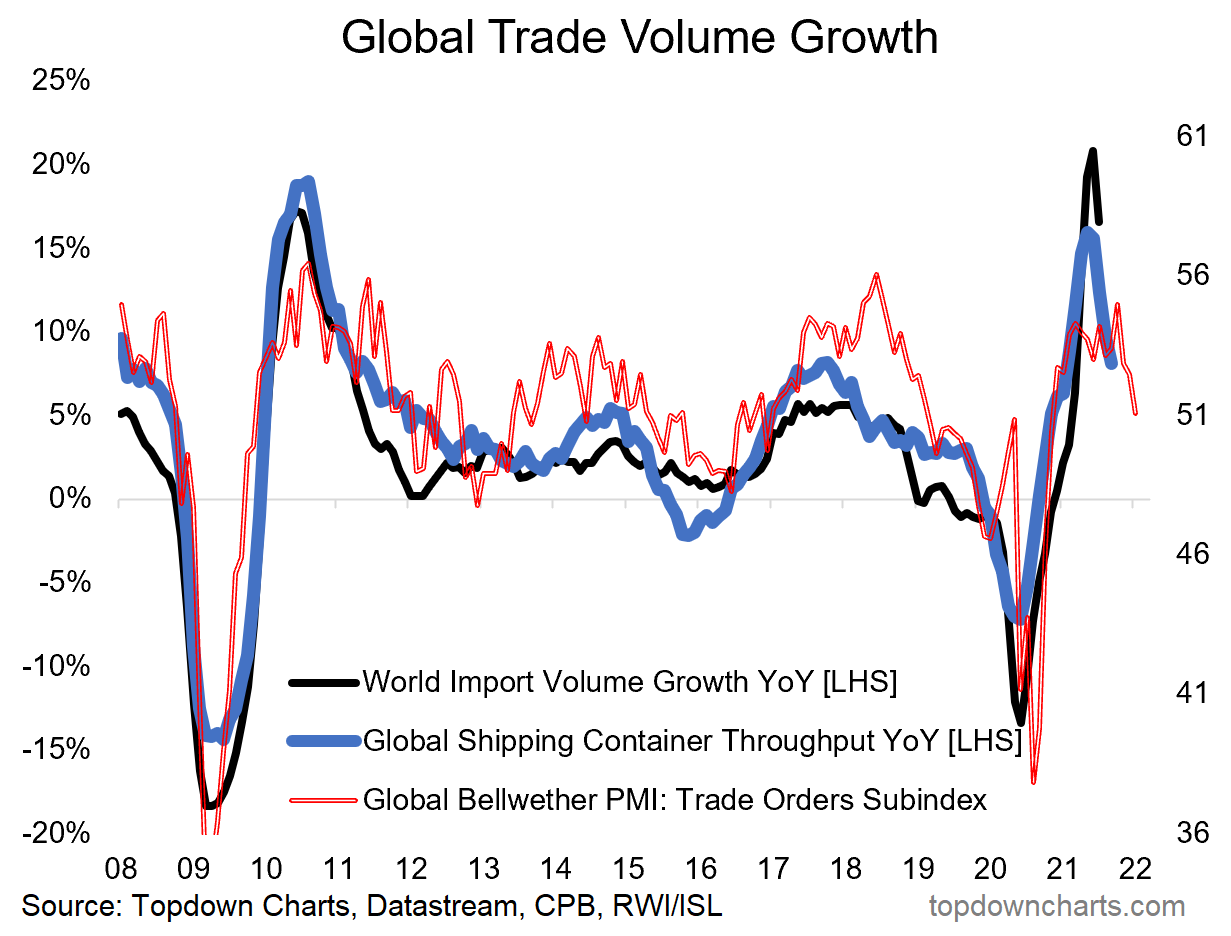
3. Global Trade Rebound: This has probably been one of the most important charts this year in so far as it reflects the key driver of backlogs (more on that in the next chart) – i.e. resurgent global trade demand. Going forward we can see the lead indicator tapering off – it was always going to be hard to maintain such a rapid pace of growth as compared to the collapse of 2020, but equally, supply chain disruption/logistics issues/shipping costs/raw materials shortages/energy costs …etc! are weighing on this as a constraint to growth.
“The global economic shutdown saw an abrupt collapse in trade growth. But since then we have seen clear green shoots and the leading indicators point to an acceleration and continuation of the global trade growth rebound into 2021.”
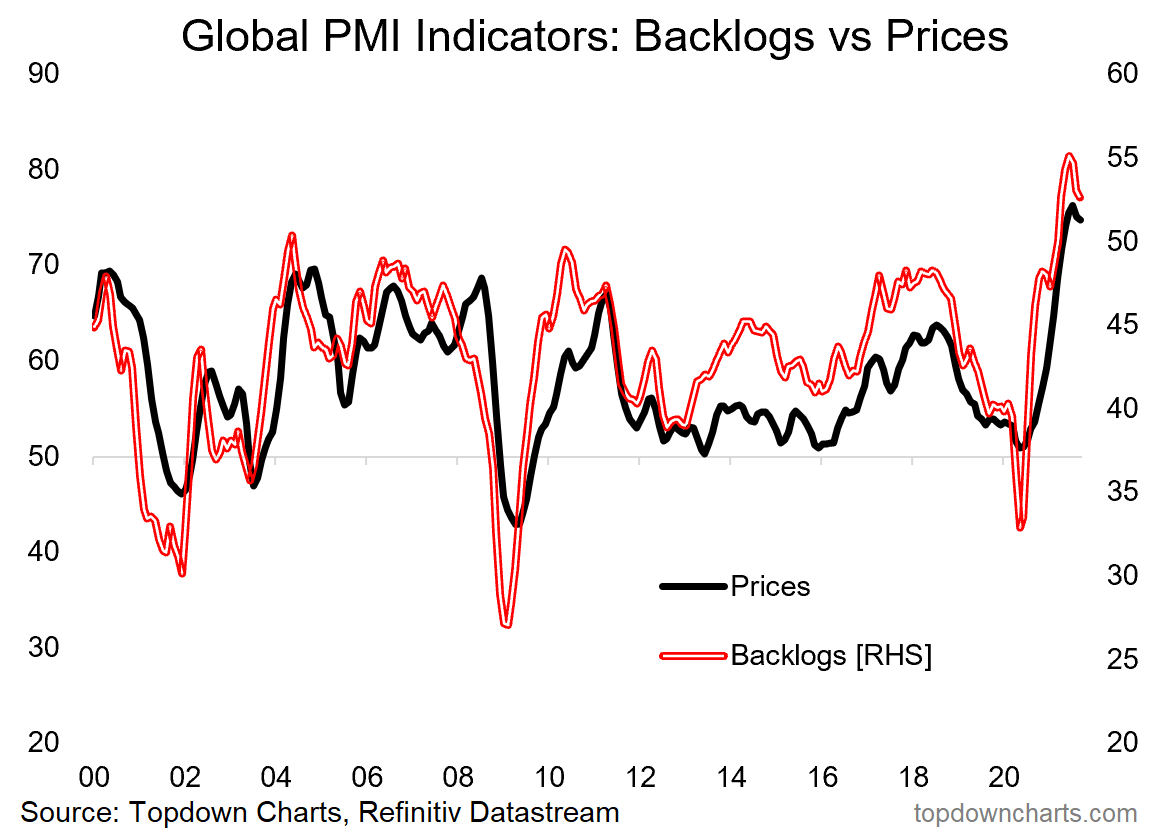
4. Global Backlogs: Ultimately I still think that the process of clearing backlogs will need to be done partly with greater activity (get the factories running overtime, invest in more capacity, re-stock inputs, etc) – so I believe aside from being a short-term constraint, that it also has the possibility to drive a further expansion of activity to work through it. Meanwhile it still seems the pricing pressures will be with us until either we see the above mentioned measures on the supply side or simply a tapering of demand. The latter seems unlikely for now, and the former will take time. One thing to note though: the chart sure does seem to show a climax on both fronts.
“A nice follow-on, the surge in backlogs (resulting from global supply chain disruption) has 2 key implications: upside risk to inflation, and a likely spike in activity as firms attempt to clear backlogs and restock inventories.”
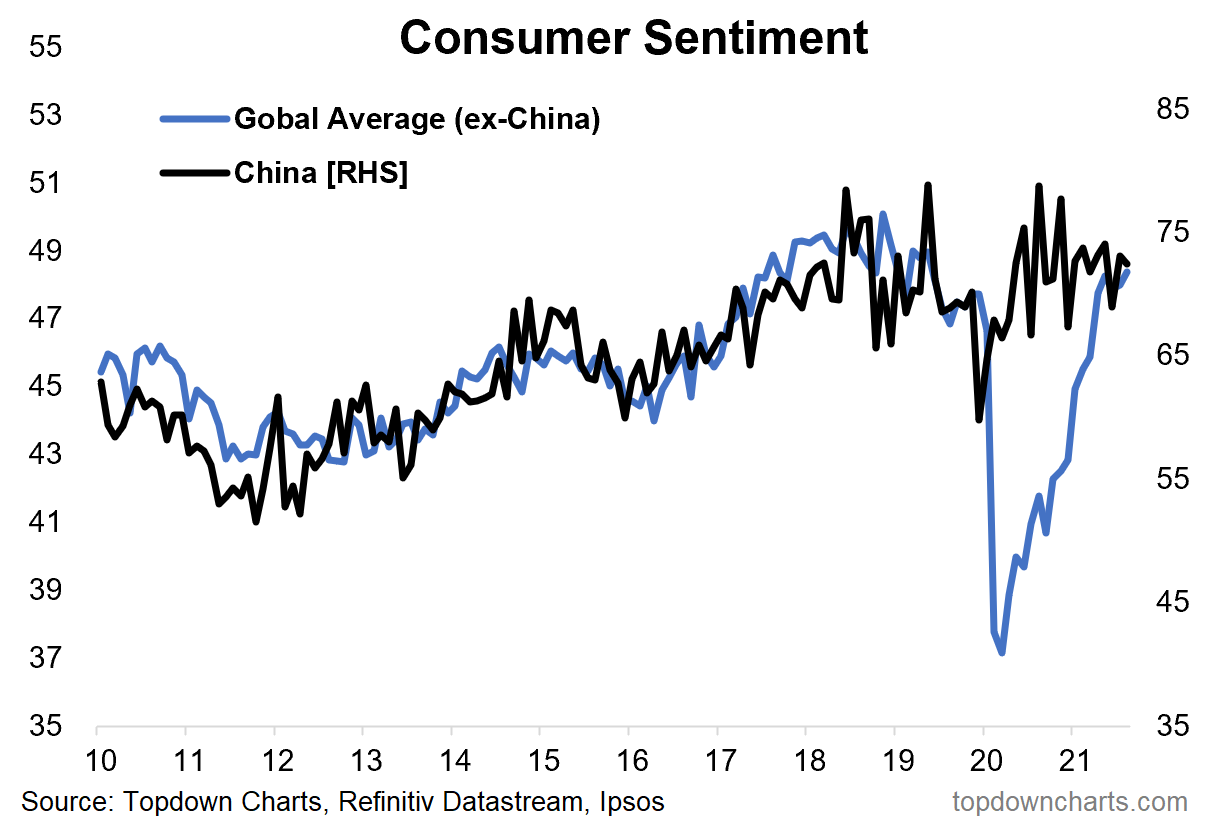
5. Consumer Normalization: There is hope. Consumers have gone from gloom to boom as asset price inflation (stocks, real estate, crypto, NFTs, an just about any traded asset!), the pandemic/lockdown induced jump in savings (albeit uneven: some have seen a jump in savings account balances, while others have had their savings wiped), very easy financing conditions and cheap borrowing costs, and increasing signals of wage inflation have all combined along with tapering of covid cases and vaccine progress – glimmers of hope of normalization have spurred things back to life on the consumer front. I think there is still gas in the tank here and see the consumer (along with capex) driving the second wave of the recovery.
“Consumer moods remain depressed *outside of China*. This chart provides a sort of playbook for the rest of the world, as well as a key means of keeping track of normalization, and a nod to a potential consumer boom post-vaccine.”
6. US vs the Rest of the World: This one is still a work in progress on both fronts – on the equities there is still an extremely compelling relative valuation case for global vs US (and anecdotally sentiment is fairly one-sided – based on how much pushback I get on Twitter!). On the US dollar, it’s gone full circle from consensus bearish at the start of the year to now increasingly consensus bullish. On the basis that I haven’t seen a good reason to abandon the bearish USD case (especially on the technicals – where the medium/longer term bear case has not been invalidated yet), I’m staying the course on both views… but back on the technicals: awaiting confirmation to ramp up conviction.
“All the key pieces of the puzzle seem to be falling into place for the rest of the world to start outperforming vs US equities. Along with that, I expect ongoing weakness in the US dollar.”

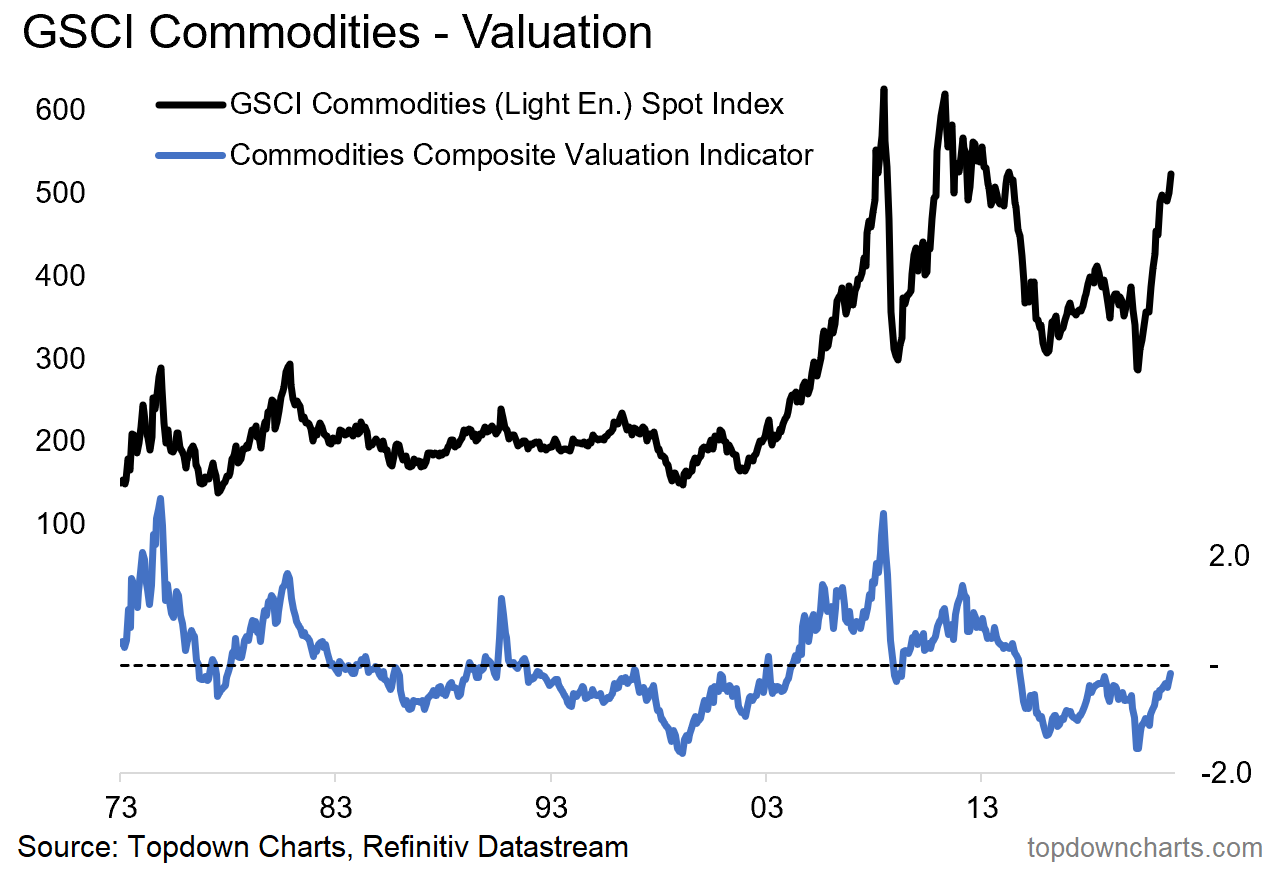
7. Commodities: This one has worked, really well. Which makes things a little complicated – I still see a very compelling case for stronger commodity prices (e.g. underinvestment in supply, thematic demand tailwinds, cyclical demand tailwinds, short-term supply disruption)… but at the same time sentiment and technicals look a little stretched. In terms of valuations, it’s about neutral (i.e. not showing up as expensive – yet).
“Given cheap valuations, a prolonged period of weak capex (i.e. futures supply tailwinds to price), pandemic disruption, an expected weaker USD, and economic recovery (with potential overshoot), remain decidedly bullish here.”
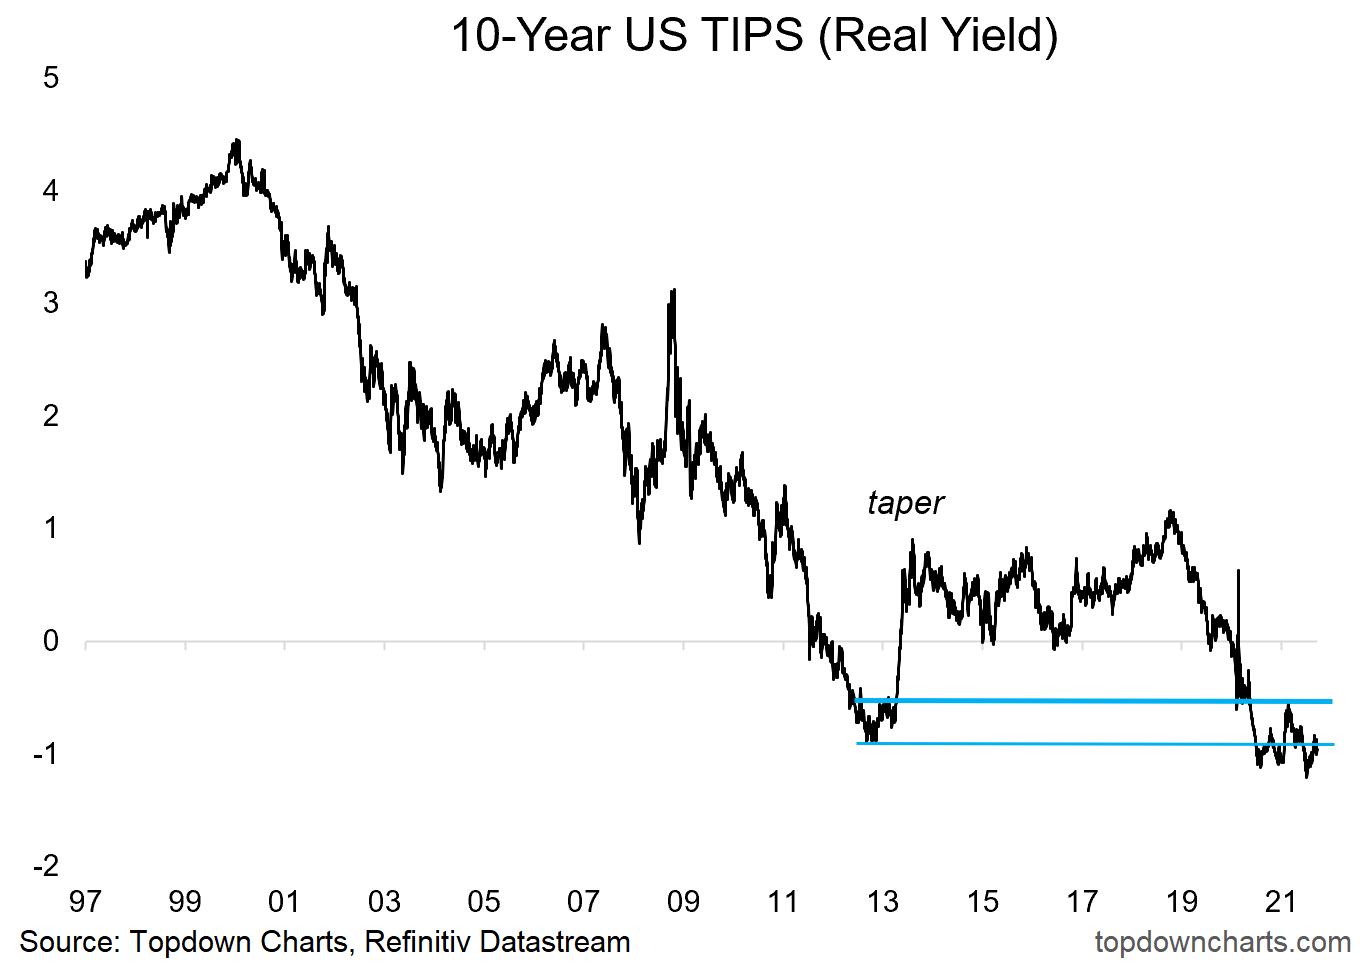
8. Real Yields: With Fed taper looming, a prospective second wave of the recovery, fiscal stimulus on the cards, and a fairly compelling case for at least higher nominal yields… it seems clear to me that the risks are skewed to the upside for real yields. But in the short-term I am mindful that inflation expectations have been gaining momentum lately, and could get kicked into a self-reinforcing loop. Again, we’re left watching the technicals for confirmation/triggers either way.
“In my view the two key drivers of US real yields are risk sentiment and growth expectations. Naturally on both fronts it was entirely rational to see real yields plunge this year. Going forward I expect improved risk sentiment and a rebound in growth expectations; therefore I expect higher real yields (and nominal yields).”
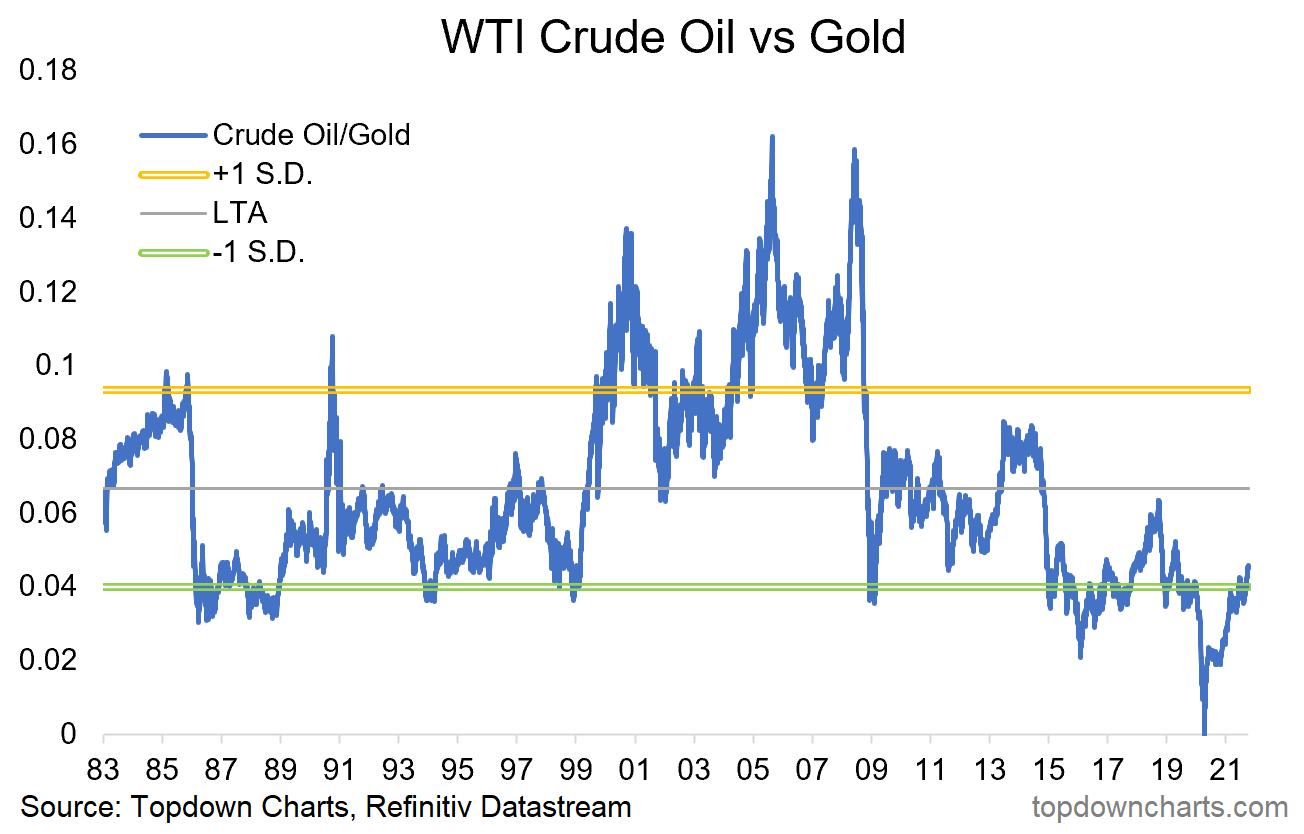
9. Crude Oil vs Gold: This one was quite an interesting and very non-consensus idea when I first started talking about it, and the way things are going (gold still looks bearish – esp. with the risk of higher real yields, and oil is going from strength to strength), it’s entirely possible it goes further… hash-tag: Mean Reversion.
“The logical next question should then be “what about gold?”. All else equal, a prospective environment of higher real yields would present a headwind to the consensus and crowded long gold trade. Aside from that, I believe a prospective passing of the torch from monetary to fiscal in the US is strong possibility (incoming Treasury Sec. Yellen has a deep appreciation for the limits of monetary policy and the need for fiscal policy to do more of the heavy lifting). This along with post-vaccine normalization should disproportionately benefit oil at the expense of gold, so I suspect we see some mean reversion in this chart.”
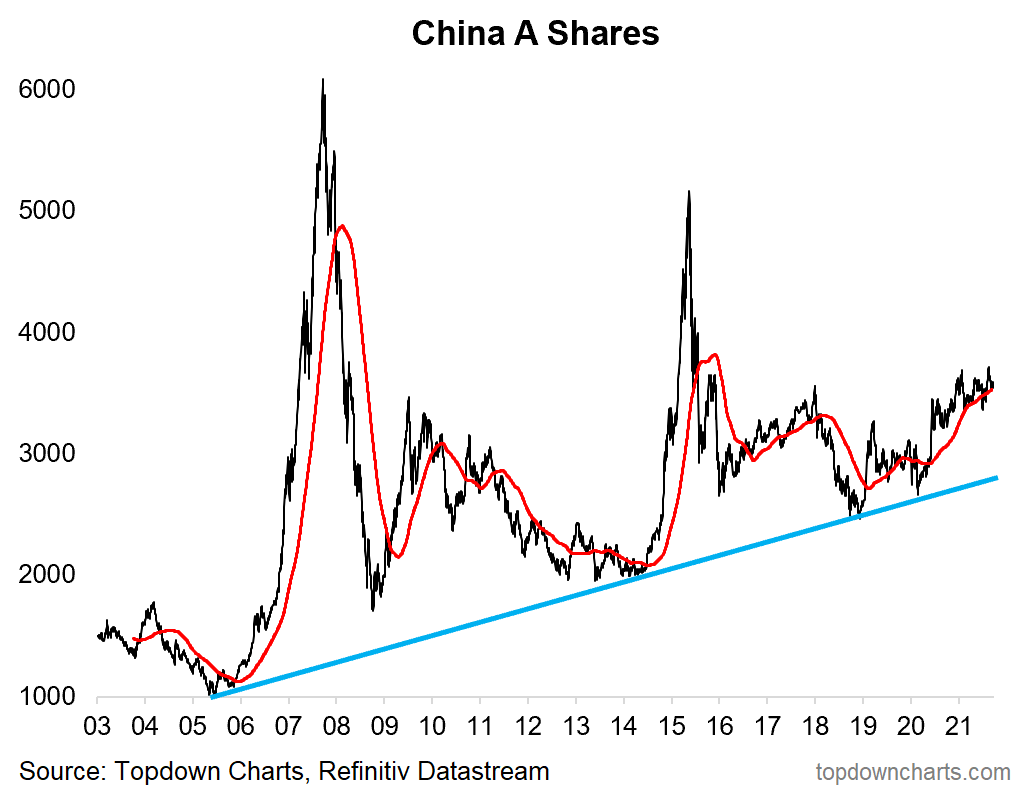
10. Chinese Equities and Emerging Markets: Despite the news flow, Chinese A-shares have been a range-trade. With this infamously ON/OFF market, it’s probably only a matter of time before policy makers end up flipping the switch one way or another. Until then, I prefer EM ex-China on relative value, and in particular prefer EM ex-Asia (relative value, sentiment/positioning, intermarkets, technicals).
“Last but not least is China. While I continue to watch a wide range of indicators, one in particular focus will be China A-shares, particularly as they brush up against a key overhead resistance level, and as policy makers in China possibly move toward actually tightening monetary policy in 2021. Indeed, in many respects, I suspect it will be more of China zigging, while the rest of the world is zagging. In any case, I remain convinced that it is still one of the most important economies and markets to watch in understanding the global macro/market picture.”
Summary and Key Takeaways:
- Policy is in the process of pivoting away from easing, but a window of low rates and easy credit conditions should help the recovery (especially capex).
- Also likely helping the second wave of the recovery is the consumer going from careful to cheerful, and a likely required flurry of activity to clear ongoing backlogs.
- The weight of risks still seem skewed to the upside for commodities (and down for USD), and hence short-term inflation pressures look likely to persist.
- The outlook across risk-assets is heavily nuanced; look for relative value, sentiment shifts, and alignment with the macro/thematic outlook for best results.
- Particularly mindful of the swing in consensus views: many of the big ideas for 2021 have been abandoned or reversed (wrong again?).
- Still plenty of interesting opportunities out there!
Best regards,
Callum Thomas
Head of Research & Founder at Topdown Charts
Twitter: https://twitter.com/Callum_Thomas
LinkedIn: https://www.linkedin.com/in/callum-thomas-4990063/

