
Late last year I sent out my 2020 End of Year Special report to clients. In that report I reflected on the year that was in terms of what charts worked well, what *didn’t* work, my favorite charts, areas of new coverage…
Q3 2020 hedge fund letters, conferences and more
But as interesting and sometimes amusing as it is to look back, as investors we get paid for looking forward, and there’s a few existing trends and themes that will remain front of mind and be key to keep on the radar in 2021.
This post is an excerpt from the 2020 end of year special report. It lays out some of the key charts and indicators I think are worth paying attention to this year (and beyond). Along with some key takeaways and themes listed a the end.
Hope you enjoy it, and indeed wishing you all the very best for 2021!
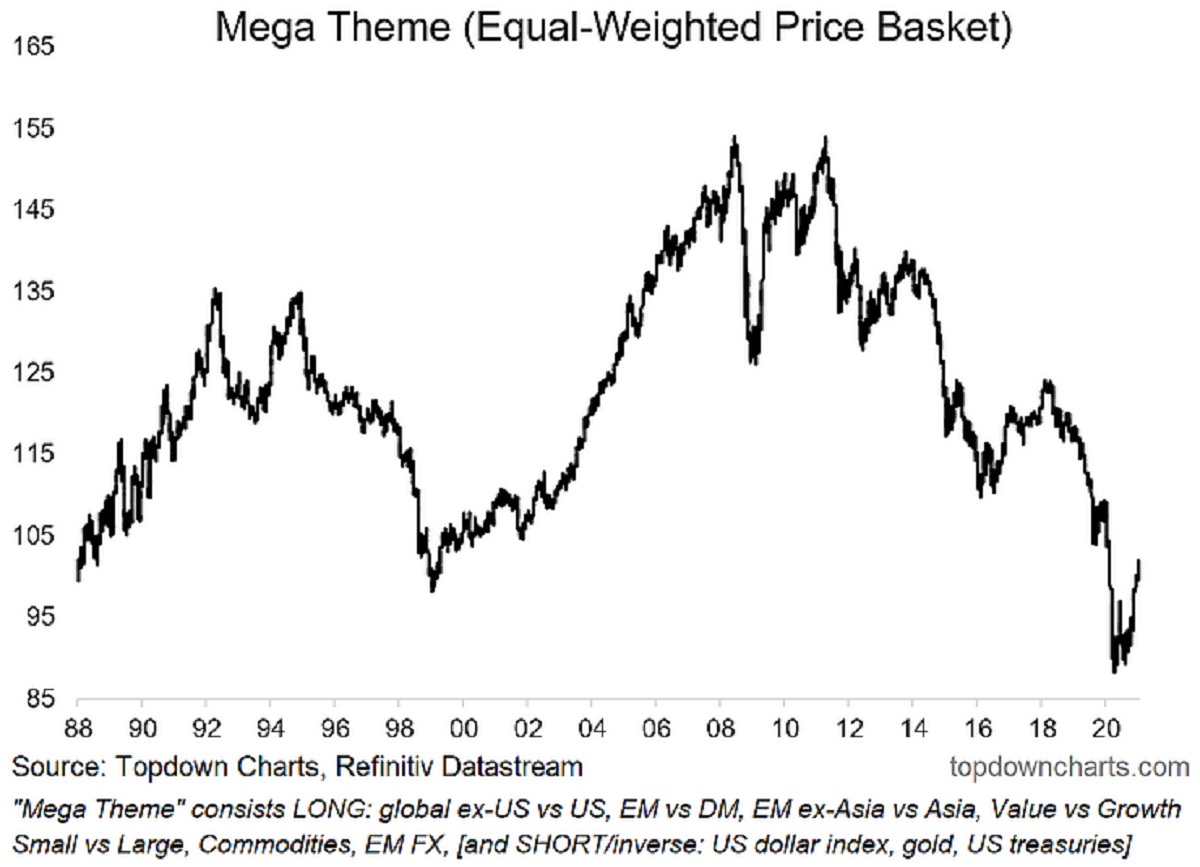
1. Mega Theme: In the last regular edition of the Weekly Macro Themes report of 2020, I decided to combine all my big ideas into one “mega theme” given some of the echoes across the ideas in terms of price action and macro drivers. The result is this interesting chart which looks to be either at or near the bottom of a long-term secular trend, and the start of at least a short-term cyclical upturn.

2. Monetary Policy (limits): The policy response to the pandemic was historic in terms of its speed, magnitude, and coordination across countries and between fiscal and monetary. But this chart perhaps highlights one limitation of monetary policy, the tag line is “interest rates are low, but good luck getting a loan” (given how much banks tightened up on lending standards). One thing on my mind is a possible passing of the torch from monetary policy to fiscal policy – as that’s going to be the thing that will achieve a more balanced and more transformative impact in the recovery.
3. Global Trade Rebound: The global economic shutdown saw an abrupt collapse in trade growth. But since then we have seen clear green shoots and the leading indicators point to an acceleration and continuation of the global trade growth rebound into 2021.
4. Global Backlogs: A nice follow-on, the surge in backlogs (resulting from global supply chain disruption) has 2 key implications: upside risk to inflation, and a likely spike in activity as firms attempt to clear backlogs and restock inventories.
5. Consumer Normalization: Consumer moods remain depressed *outside of China*. This chart provides a sort of playbook for the rest of the world, as well as a key means of keeping track of normalization, and a nod to a potential consumer boom post-vaccine.
6. US vs the Rest of the World: All the key pieces of the puzzle seem to be falling into place for the rest of the world to start outperforming vs US equities. Along with that, I expect ongoing weakness in the US dollar.
7. Commodities: Given cheap valuations, a prolonged period of weak capex (i.e. futures supply tailwinds to price), pandemic disruption, an expected weaker USD, and economic recovery (with potential overshoot), remain decidedly bullish here.
8. Real Yields: In my view the two key drivers of US real yields are risk sentiment and growth expectations. Naturally on both fronts it was entirely rational to see real yields plunge this year. Going forward I expect improved risk sentiment and a rebound in growth expectations; therefore I expect higher real yields (and nominal yields).
9. Crude Oil vs Gold: The logical next question should then be “what about gold?”. All else equal, a prospective environment of higher real yields would present a headwind to the consensus and crowded long gold trade. Aside from that, I believe a prospective passing of the torch from monetary to fiscal in the US is strong possibility (incoming Treasury Sec. Yellen has a deep appreciation for the limits of monetary policy and the need for fiscal policy to do more of the heavy lifting). This along with post-vaccine normalization should disproportionately benefit oil at the expense of gold, so I suspect we see some mean reversion in this chart.
10. China: Last but not least is China. While I continue to watch a wide range of indicators, one in particular focus will be China A-shares, particularly as they brush up against a key overhead resistance level, and as policy makers in China possibly move toward actually tightening monetary policy in 2021. Indeed, in many respects, I suspect it will be more of China zigging, while the rest of the world is zagging. In any case, I remain convinced that it is still one of the most important economies and markets to watch in understanding the global macro/market picture.
Summary and Key Takeaways:
- Monetary policy remains of critical importance, but expect less monetary and more fiscal stimulus going forward.
- Anticipate follow-through on the global economic recovery as stimulus, green shoots, and clearing of backlogs coalesce.
- Expect the risk-on/reflation/recovery macro environment helps some of the previously unfavored asset classes, and drives rotation within and across markets.
- Anticipate a more nuanced approach to global equity allocations will be more appropriate than just market cap weights: fade passive.
- Likely further upside for commodities, higher bond yields, and weaker USD.
- Again, thanks for your interest and your support – make sure to follow as I will provide a few progress-check updates to this article as the year goes on.
Indeed, (by way of example) in case you missed it, here’s the end of year update to the 10 Charts to Watch in 2020 from last year.
Best regards and best of luck,
Callum Thomas
Head of Research and founder of Topdown Charts
Follow us on:
LinkedIn https://www.linkedin.com/company/topdown-charts
Twitter http://www.twitter.com/topdowncharts
Article by Top Down Charts

