
Key highlights for September 2018:
- Hedge funds were up 0.26% for the year, their weakest performance on record since 2011 when they declined -2.96% in the nine months through to September. Almost 49% of the managers are in the green for the year with roughly 11% of these managers posting double digit gains as tracked in the Eurekahedge Global Hedge Funds Database.
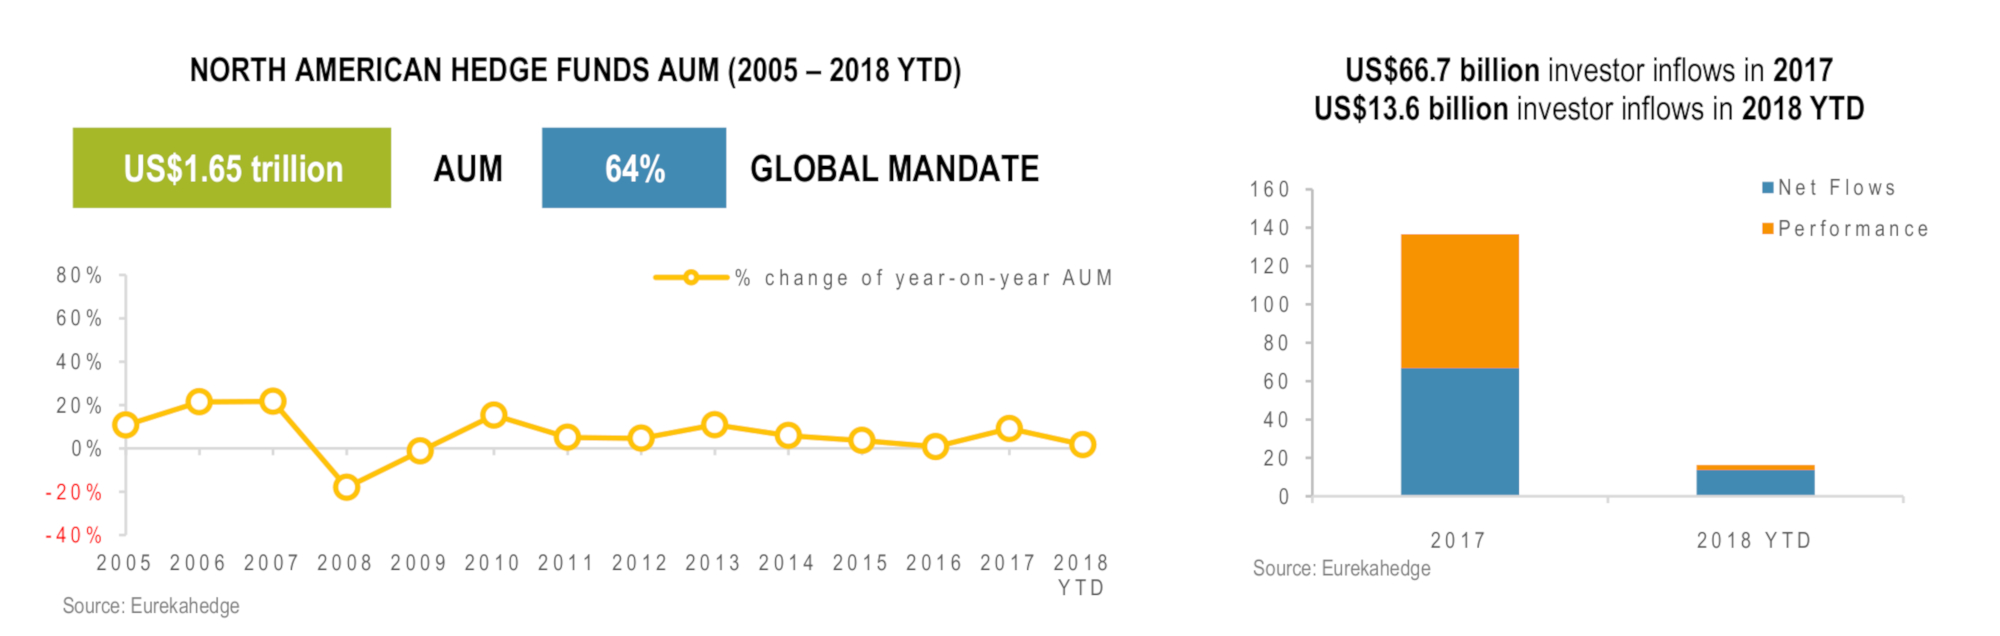
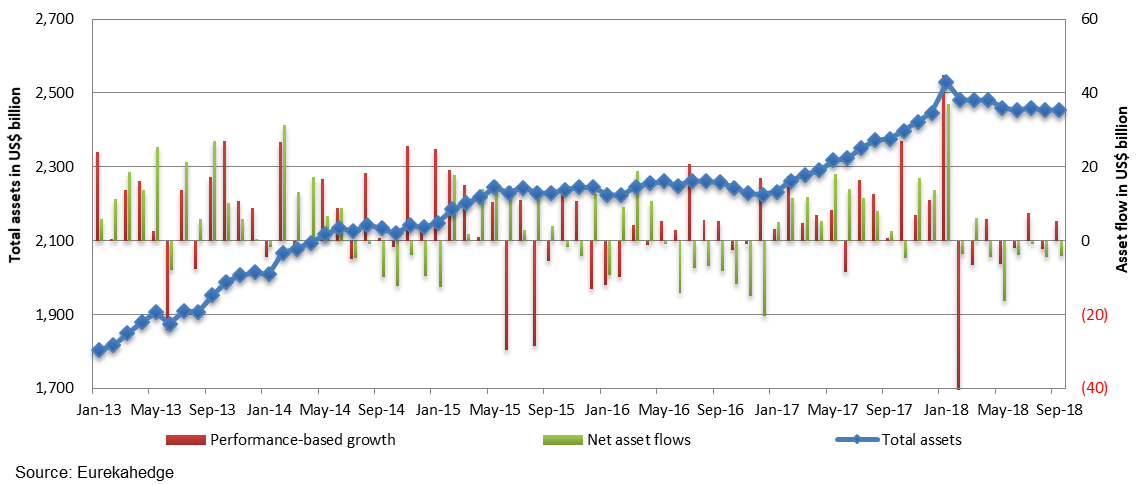
- Total assets under management have increased by US$8.0 billion as of September 2018 year-to-date, down from US$150.7 billion over the same period last year as performance-driven losses and subdued allocations from investors cap asset growth. Barring January earlier this year, investors have redeemed US$31.4 billion from hedge funds globally through to September. For detailed asset flow breakdown across regions, strategies and fund size mandates click here.
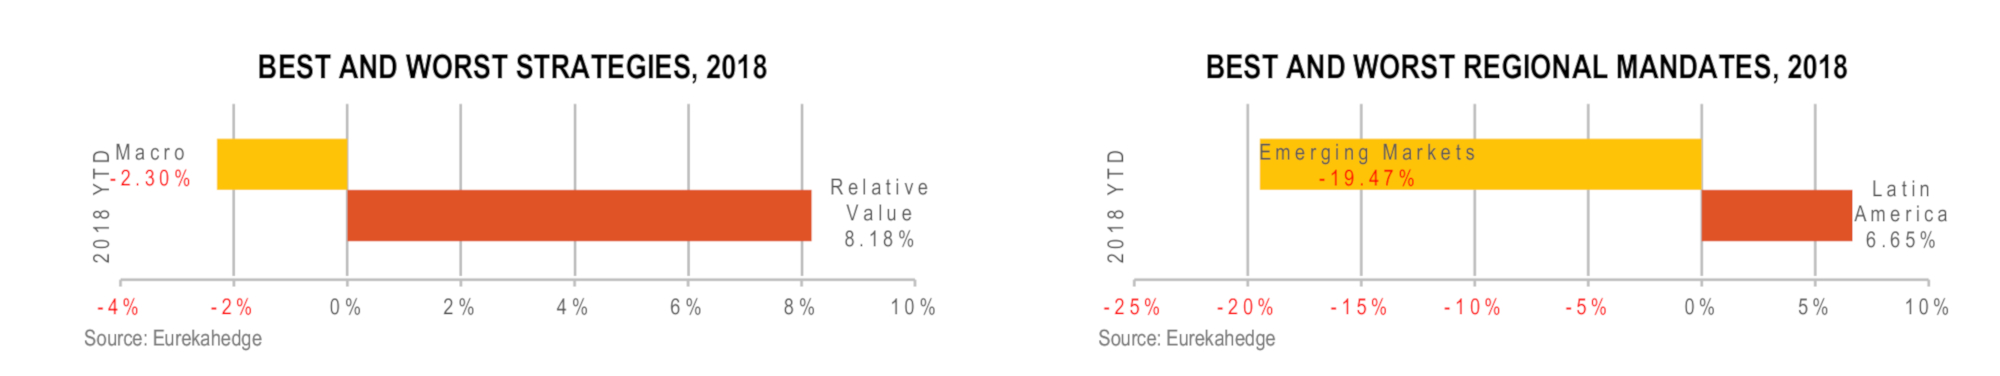
- Emerging markets focused mandates are in the red for the year down 3.43% YTD, with Asian managers down 4.05% for the year and the underlying Eurekahedge Greater China Hedge Fund Index posting losses of 8.16% as of September 2018.
- Across strategies, distressed debt, relative value and fixed income hedge funds lead for the year up 8.63%, 3.37% and 1.66% respectively.
- Assets under management for CTAs/managed futures strategies have shrunk by almost 8% in 2018 – corresponding to a decline in AUM of US$21.3 billion in the first eight months of the year. Meanwhile multi-strategy hedge funds have recorded the steepest redemptions for the year totalling US$19.4 billion.
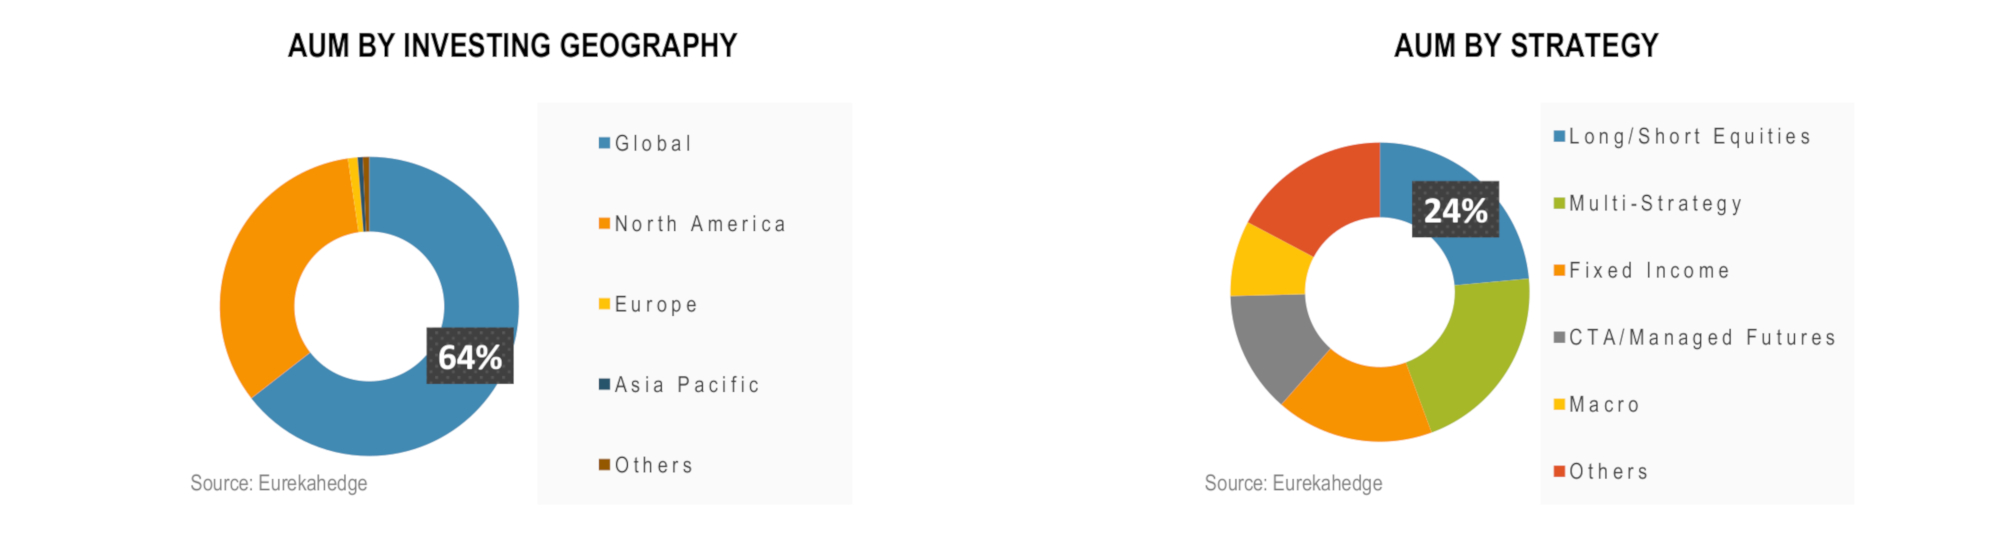
- Across both equities and fixed income assets, North American hedge fund managers remain the bright spot with underlying long/short equity managers up 5.74% whilst fixed income focused mandates have gained 5.35% as of September 2018 year-to-date. In contrast, emerging markets focused equity long/short managers are down 6.32% while fixed income mandates have lost 1.56% for the year.
- The Eurekahedge Crypto-Currency Hedge Fund Index is down 54.5% for the year. The index has lost more than half of its value over the first nine months of 2018, as fund managers struggled to mitigate the damage caused by the crypto-currency market crash following gains of 1708.5% in 2017.
Q3 hedge fund letters, conference, scoops etc
2018 Key Trends in North American Hedge Funds
The Eurekahedge Hedge Fund Index ended the month down 0.06% trailing closely behind global equity markets as represented by the MSCI AC World Index (Local) which edged 0.07% higher in September. Roughly half of the hedge fund managers tracked by Eurekahedge managed to generate positive returns over the month. On a year-to-date basis, the Eurekahedge Hedge Fund Index was up 0.26% as of September 2018, with 11% of the constituent funds generating double-digit returns over the first three quarters of the year.
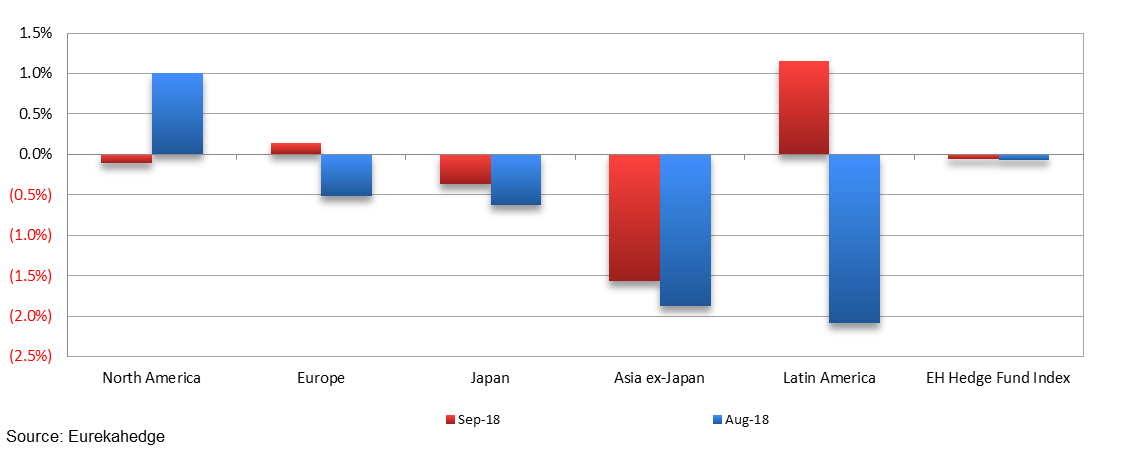
Across geographic mandates, North American hedge funds ended their winning streak and languished into negative territory in September, with the Eurekahedge North American Hedge Fund Index down 0.11%. This was contrary to the strong performance of the S&P 500 index which ended the quarter with its best return since the end of 2013. Concerns over the trade friction and weak currencies continued to loom over the Asian equity markets, and prompted the PBOC to reduce the reserve requirements again in early October, to improve liquidity. Latin American fund managers ended the month on a positive note, owing to the rebound of Brazilian equities following the decline in August.
September 2018 and August 2018 returns across regions
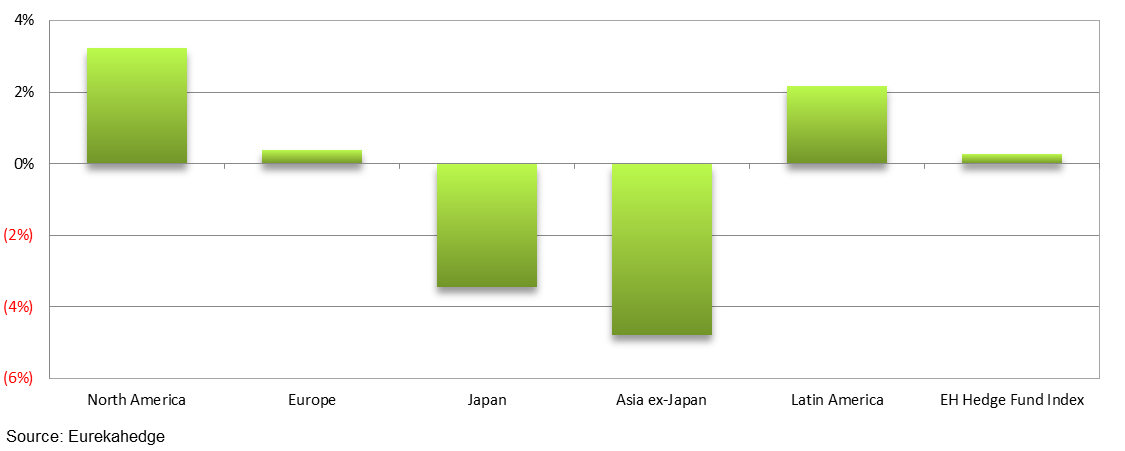
On a year-to-date basis, North American fund managers were up 3.22%, followed by Latin American and European fund managers, which gained 2.16% and 0.37% over the first three quarters of 2018. Meanwhile, Asian fund managers continued to lag behind their peers investing in other regions, with the Eurekahedge Asia ex Japan Hedge Fund Index and the Eurekahedge Japan Hedge Fund Index down 4.78% and 3.44% respectively, following consecutive months of losses.
2018 year-to-date returns across regions
Mizuho-Eurekahedge Asset Weighted Index
The asset-weighted Mizuho-Eurekahedge Index – USD ended September up 0.39%, bringing their 2018 year-to-date return to -1.11%. It should also be noted that the Mizuho-Eurekahedge Index is US dollar denominated, and during months of strong US dollar gains, the index results include the currency conversion loss for funds that are denominated in other currencies. The noticeable discrepancy between the asset-weighted Mizuho-Eurekahedge Index – USD and the equal-weighted Eurekahedge Hedge Fund Index which declined 0.06% in September were induced by the performance distribution of the constituent fund managers. Hedge fund managers overseeing assets larger than US$1 billion outperformed their smaller peers, and roughly 60% of these billion dollar funds were in the positive territory during the month.
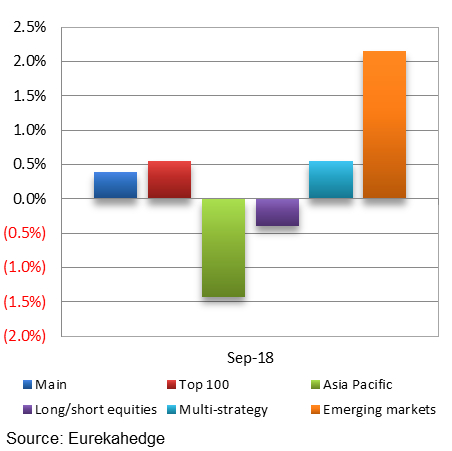
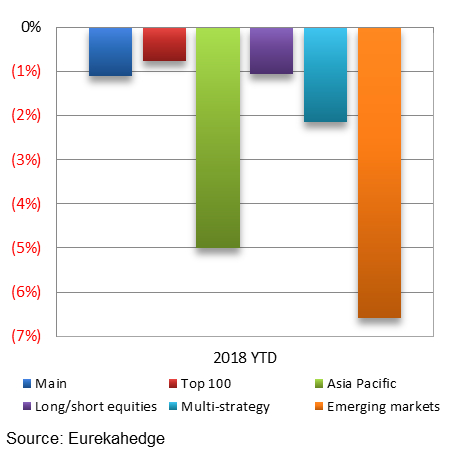
Performance distribution among the suite of Mizuho-Eurekahedge Indices were a mixed bag during the month, with the Mizuho-Eurekahedge Emerging Markets Index topping the chart as they gained 2.15% over the month, supported by the rebound in Latin America and Eastern Europe equity markets. On the other end of the spectrum, the Mizuho-Eurekahedge Asia Pacific Index declined 1.43%, marking its fourth consecutive month of losses. On a year-to-date basis, all indices were in the red, with emerging markets and Asia Pacific focused fund managers posting the sharpest declines as they ended the first three quarters of 2018 down 6.59% and 5.01% respectively, weighed by the weak emerging market currencies and global trade friction which has seen investors fleeing emerging markets since February.
|
Mizuho-Eurekahedge Indices September 2018 returns
|
Mizuho-Eurekahedge Indices 2018 year-to-date returns
|
CBOE Eurekahedge Volatility Indexes
The CBOE Eurekahedge Volatility Indexes comprise four equally-weighted volatility indices – long volatility, short volatility, relative value and tail risk. The CBOE Eurekahedge Long Volatility Index is designed to track the performance of underlying hedge fund managers who take a net long view on implied volatility with a goal of positive absolute return. In contrast, the CBOE Eurekahedge Short Volatility Index tracks the performance of underlying hedge fund managers who take a net short view on implied volatility with a goal of positive absolute return. This strategy often involves the selling of options to take advantage of the discrepancies in current implied volatility versus expectations of subsequent implied or realised volatility. The CBOE Eurekahedge Relative Value Volatility Index on the other hand measures the performance of underlying hedge fund managers that trade relative value or opportunistic volatility strategies. Managers utilising this strategy can pursue long, short or neutral views on volatility with a goal of positive absolute return. Meanwhile, the CBOE Eurekahedge Tail Risk Index tracks the performance of underlying hedge fund managers that specifically seek to achieve capital appreciation during periods of extreme market stress.
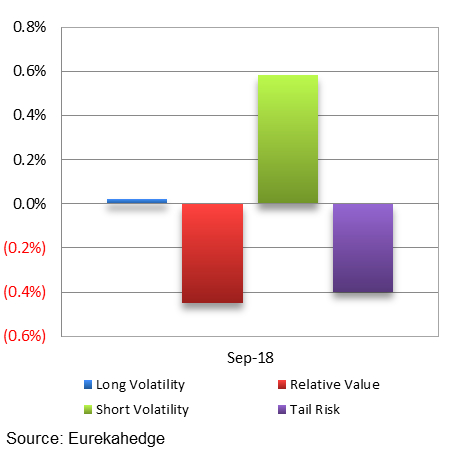
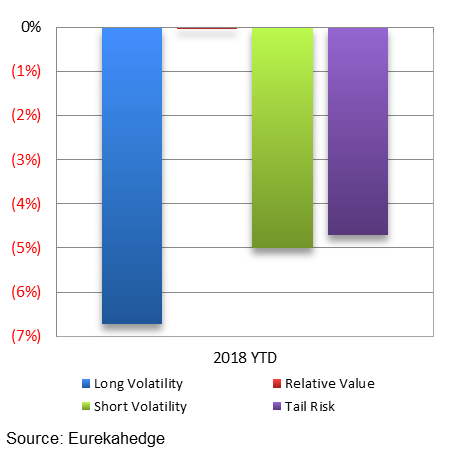
The CBOE Eurekahedge Short Volatility Hedge Fund Index ended the month on a positive note, returning 0.58% in September and bringing their year-to-date return to -4.99%. Fund managers utilising relative value volatility and tail risk strategies posted losses of 0.45% and 0.40% respectively, while long volatility fund managers ended the month flat. On a year-to-date basis, all of the volatility strategies remained in the red, with long volatility fund managers posting the steepest losses of 6.72%. The CBOE Eurekahedge Relative Value Volatility Hedge Fund Index dipped back into the red after September’s losses, and ended the quarter down 0.04% year-to-date.
|
CBOE Eurekahedge Volatility Indexes September 2018 returns
|
CBOE Eurekahedge Volatility Indexes 2018 year-to-date returns
|
Summary monthly asset flow data since January 2013
Eurekahedge
Launched in 2001, Eurekahedge has a proven track record spanning over 16 years as the world’s largest independent data provider and alternative research firm specialising in global hedge fund databases and research. Headquartered in Singapore with offices in New York and Philippines, the global expertise of our research team constantly adapts to industry changes and needs, allowing Eurekahedge to develop and offer a wide array of products and services coveted by institutional investors, family offices, accredited investors, qualified purchasers, financial institutions and media sources. In addition to market-leading hedge fund databases, Eurekahedge’s other business functions include hedge fund research publications, due diligence services, investor services, analytical platforms and risk management tools.

