
We are more than a decade into the bull market. Unemployment continues to remain low and wages are inching higher. These factors benefit railroads, because as more people are employed, they have more disposable income. This means more goods can be purchased, many of which are shipped from ports to the consumer.
Q3 hedge fund letters, conference, scoops etc
ValueWalk readers can click here to instantly access an exclusive $100 discount on Sure Dividend’s premium online course Invest Like The Best, which contains a case-study-based investigation of how 6 of the world’s best investors beat the market over time.
As a cheap, effective way of transporting goods, railroads often see higher volumes and revenues when economic conditions are strong. Slightly offsetting these factors are a decrease in energy prices.
This past June, we examined six railroad companies in an effort to determine their total annual return possibilities over the next five years. This article will look at each railroad’s most recent financial release, dividend history and valuation in order to rank them by expected total return through 2023.
Top Railroad Stock #6: Union Pacific (UNP)
- Total Annual Return Potential through 2023: 1.7%
- Previous Railroad Rank: #6
The Pacific Railway Act of 1862 authorized the Union Pacific Railroad Company to build a line west from the Missouri River to meet a line coming east from Sacramento. With 32,000 miles of track, Union Pacific is the largest railroad in the U.S. Sales totaled nearly $21 billion in 2017 and the company has a current market capitalization of $113 billion.
Union Pacific released third quarter financial results on October 25th.
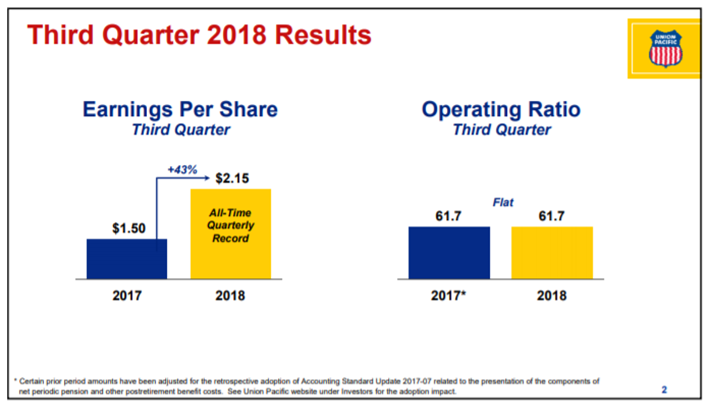
Source: Union Pacific’s Third Quarter Results Presentation, slide 2.
The company earned $2.15 per share, which was $0.06 higher than the average analysts’ estimate and a 43% increase from the previous year. Revenue grew 9.6% to $5.9 billion. Union Pacific’s operating ratio of 61.7% was flat year-over-year, but did improve on a sequential basis from the second quarter’s ratio of 63%.
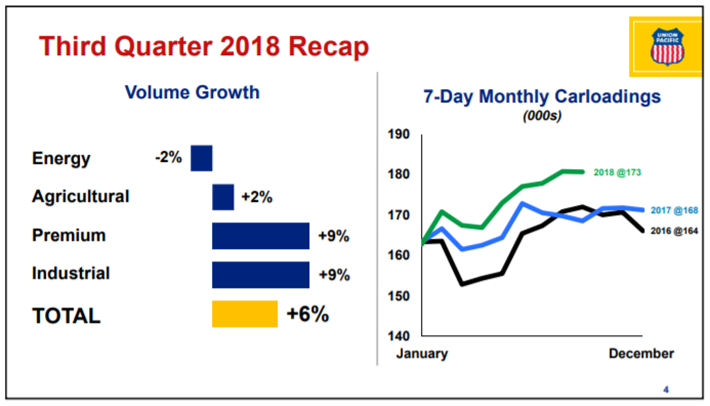
Source: Union Pacific’s Third Quarter Results Presentation, slide 4.
Union Pacific benefited from higher volumes and prices during the quarter. Outside of energy, which had a 2% decline, all shipment types saw positive volume increases. Industrial results were strong, with 9% volume growth accompanied by a 13% climb in revenues. Demands in construction and industrial product end markets were the main drivers of these increases. Premium revenues were up 18% while volumes were higher by 9%. Stronger truck and SUV sales were the primary contributors to these growth rates. Agriculture transports experienced a 2% gain in volumes and a 6% increase in revenues. Feed grains and biofuel demand more than offset weakness in wheat exports. Volumes for frac sand dropped 23% while coal shipments were down 3%. Energy revenues did grow 1%.
Union Pacific expects an earnings-per-share (EPS) midpoint of $7.59 for the year. If achieved this would represent 31% growth from 2017. Union Pacific has grown EPS at a rate of 4% over the past five years.
Union Pacific, with dividends increases for the past twelve years, is a Dividend Achiever. The company has increased its dividend:
- By an average of 11.2% per year over the past three years.
- By an average of 14.8% per year over the past five years.
- By an average of 22.1% per year over the past ten years.
Union Pacific has given shareholders three dividend increases in the last twelve months. For the December 2017 payment, the company raised its dividend by 9.9%. Then for the March 2018 payment the dividend was increased 9.8%. Finally, Union Pacific raised its dividend 9.9% for the payment made this past September. 2018 dividends will total $3.06, a 23.4% increase from 2017’s total. Based off of expected EPS, the company’s payout ratio is just 40.3%. Union Pacific shares currently yield 2.1%.
Union Pacific’s stock closed at $151.68 on 12/6/2018. The stock has a current price-to-earnings ratio (P/E) of 20. This is above Union Pacific’s ten-year average P/E ratio of 16. If shares were to revert to their average P/E ratio by 2023, then this would reduce the stock’s annual returns by 4.4% per year.
Combining earnings growth (4%), dividends (2.1%) and multiple reversion (-4.4%), we expect that Union Pacific can offer total annual returns of just 1.7% through 2023. In our previous article, we forecasted a total annual return of 2.2%.
While we are impressed with the company’s dividend growth over the last year, Union Pacific offers the lowest total return of any railroad on our list.
Top Railroad Stock #5: Norfolk Southern (NSC)
- Total Annual Return Potential through 2023: 5.1%
- Previous Railroad Rank: #4
Founded in 1980, Norfolk Southern is the youngest railroad on our list. The company has more than 19,000 miles of routes through twenty-two states in the Southeast, East, and Midwest portions of the U.S. The company transports freight between points on the Atlantic coast and the Gulf of Mexico. Norfolk had $10.6 billion in sales in 2017 and has a current market cap of $45.2 billion.
Norfolk Southern reported financial results for the third quarter on October 24th.
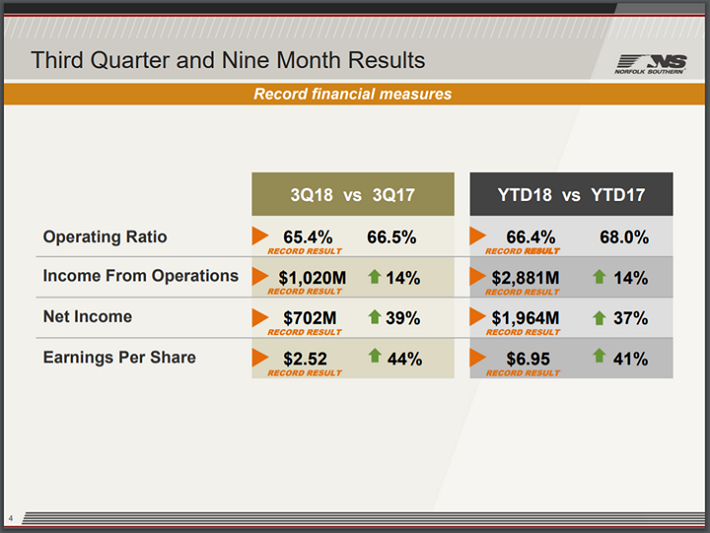
Source: Norfolk Southern’s Third Quarter Results Presentation, slide 4.
Norfolk Southern earned $2.52 per share during the quarter, beating estimates by $0.06 and showing growth of 44% year-over-year. Revenue increased 10.5% to $2.95 billion. This was $40 million ahead of estimates. The railroad’s operating ratio improved more than 1% to 65.4%. Norfolk Southern saw record results on nearly all metrics. Still, this is the highest operating ratio of any of the railroads.
Norfolk Southern saw strength across all of its product categories.
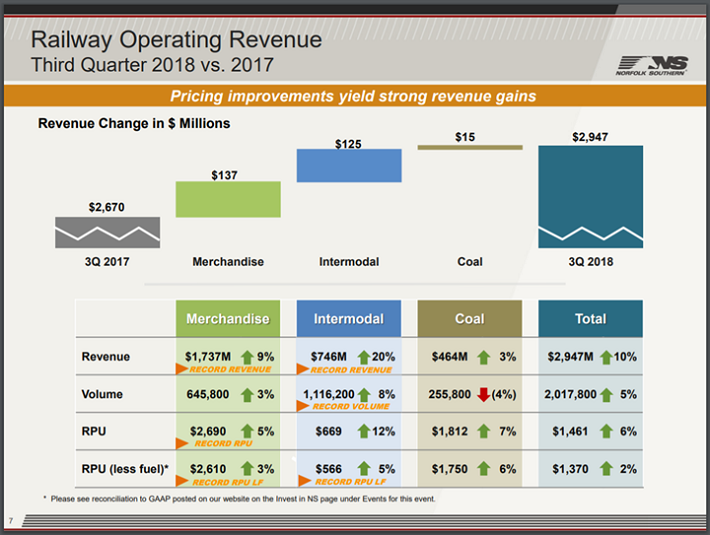
Source: Norfolk Southern’s Third Quarter Results Presentation, slide 4.
Norfolk Southern reported improved revenues and higher revenue per unit figures for every type of product shipped. The company also saw higher volumes for all products except for coal. Overall volumes were up 5% due in large part to 8% growth in intermodal. Intermodal set a company record for volumes. Even though coal saw a 4% decline in volumes, total revenue grew 3% and revenue per unit was up 7%.
Norfolk Southern saw a 9% increase in expenses as fuel prices rose 38%. On the positive side, train speed increased 6% and terminal dwell improved 7%. Fuel efficiency was a company record and train length a quarterly record.
Norfolk Southern is expected to earn $8.95 per share in 2018. This would result in a gain of nearly 37% from last year. We expect earnings to grow at a rate of 6.4% annually.
Norfolk Southern had increased its dividend in fourteen out of the last fifteen years, pausing growth in 2016. The company has increased its dividend:
- By an average of 1.1% per year over the last three years.
- By an average of 3.6% per year over the last five years.
- By an average of 7.2% per year over the last ten years.
While dividend growth is below that of most of the other railroads, Norfolk Southern did increase its dividend by 11% for the payment made this past September. This follows an 18% increase that the company announced for the March payment. Norfolk Southern will pay out $3.04 in dividends-per-share this year. Based off of expected EPS, this equates to a payout ratio of 34%. The stock has a yield of 1.9%.
Norfolk Southern’s shares closed on Thursday at $162.19. Using expected earnings for the year of $8.95 gives the stock a P/E of 18.1. We have a 2023 P/E target of 15.5. If shares were to revert to this target, shareholders would see the multiple reversion at a rate of -3.1% per year over the next five years.
We believe that Norfolk Southern can offer a total annual return of 5.2% through 2023. This estimate is based off of growth (6.4%), dividends (1.9%) and multiple contraction (-3.1%). We had previously estimated an annual return of 5.1% for Norfolk Southern.
Norfolk Southern did see a slight increase in our estimated total return, but dropped a spot in our rankings. We like that the railroad saw record results on several metrics, including operating ratio and net income, but we feel the other names in the space offer better opportunities.
Top Railroad Stock #4: CSX Corporation (CSX)
- Total Annual Return Potential through 2023: 5.3%
- Previous Railroad Rank: #5
CSX operates 21,000 miles of routes in the Eastern United States. The railroad has been in existence since the 1820s and started with just thirteen miles of track. Today CSX covers twenty-three states. CSX generated more than $11 billion in revenue last year and has a market capitalization of $59.6 billion.
CSX reported third quarter financial results on October 16th.
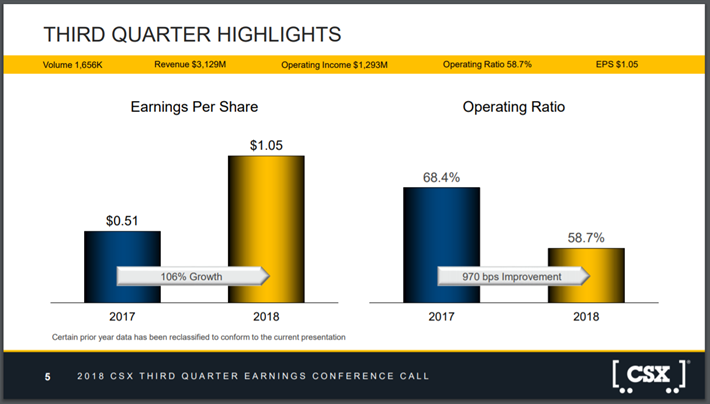
Source: CSX’s Third Quarter Earnings Presentation, page 5.
CSX saw earnings more than double year-over-year to $1.05 per share in the third quarter. This was also $0.12 above estimates. Revenue increased 14% to $3.13 billion. CSX’s operating ratio was a company record 58.7% during the quarter and one of the lowest on our list of railroads. For comparison, the company had an operating ratio of 68.4% during the third quarter of 2017. Revenue per unit increased 9% while the company’s tax rate was 22.3%.
Almost every type of transport category saw growth during the quarter.
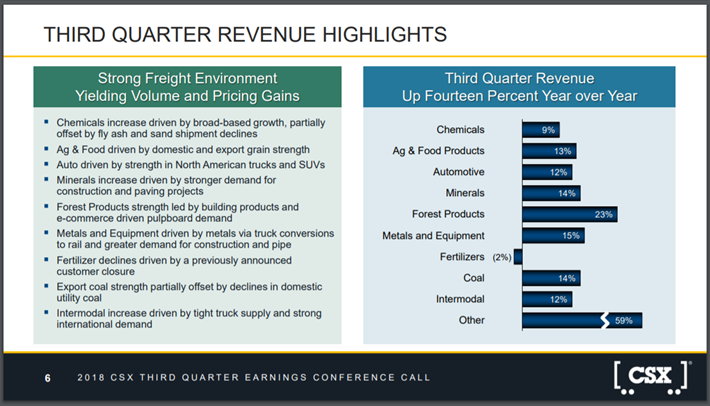
Source: CSX’s Third Quarter Earnings Presentation, page 6.
While grain exports have been a headwind for several railroads, CSX saw an increase in international shipments. Revenues for autos improved 12% due in part to demand for trucks and SUVs. Coal exports helped to make up for continued weakness in demand for the product from utility plants. Intermodal revenues improved 12%, in large part because of international intermodal shipments. Demand for construction and pipe helped grow metals & equipment revenues 15%. Forest product sales were up 23% as demand continues to grow for paper boxes for online shippers.
Gains in freight revenues were impressive, but CSX’s operating ratio performance should also stand out to investors. Train velocity improved 28% to 17.9 MPH. Terminal dwell declined almost 26% to just nine hours. CSX also had 14% fewer cars online, resulting in double-digit savings on car maintenance. With faster train speed, shorter terminal dwell and fewer cars, CSX’s trains were able to significantly boost their efficiency.
CSX saw a 15% reduction in capital costs, which helped lead to 55% growth in free cash flow before dividends. The company also has bought back $2.8 billion of its own stock year-to-date.
CSX expects an EPS midpoint of $3.60 for 2018, which would be a 56.5% improvement from the previous year. We expect shares of CSX to offer earnings growth of 9% through 2023.
CSX has increased its dividend for the past fourteen years. The company has increased its dividend:
- By an average of 7.4% per year over the past three years.
- By an average of 7.6% per year over the past five years.
- By an average of 15.8% per year over the past ten years.
CSX last raised its dividend for the payment made in March 2018. That increase raised the dividend 10%. Shares of CSX currently yield 1.3%. The company currently pays out $0.88 in annual dividends. Based off of expected EPS, this represents a payout ratio of just 24.4%, the lowest payout ratio on our list.
CSX’s most recent closing price was $69.82. Using the company’s EPS guidance, CSX’s stock has a P/E ratio of 19.4. This is higher than the stock’s ten-year average P/E ratio of 15. If shares were to reach our target P/E ratio, then shares of CSX could experience a multiple contraction of -5% per year over the next five years.
Based off our expected growth rate (9%), dividends (1.3%) and multiple reversion (-5%), we forecast that CSX can offer investors a total return of 5.3% per year through 2023. Our prior forecast for total annual returns had been 3.6%.
CSX had the second best operating ratio of all the major railroads and was able to improve on this metric by almost 1000 basis points. The railroad also has one of our highest expected earnings growth rates. CSX’s stock has moved up a notch on our ranking and we would encourage investors to consider the company on a pullback.
Top Railroad Stock #3: Canadian National Railway (CNI)
- Total Annual Return Potential through 2023: 5.7%
- Previous Railroad Rank: #3
Canadian National Railway is one of two Canadian based railroads on our list. The company operates approximately 20,000 miles of railroad in North America. Canadian National Railway’s track connects to both the Atlantic and Pacific oceans as well as to the Gulf of Mexico. The railway transports more than $200 billion worth of products per year all while moving more than 300 million tons of cargo. Canadian National Railway had $10 billion in sales in 2017 and currently sports a market cap of $60 billion.
Canadian National Railway reported result for the third quarter on October 23rd.
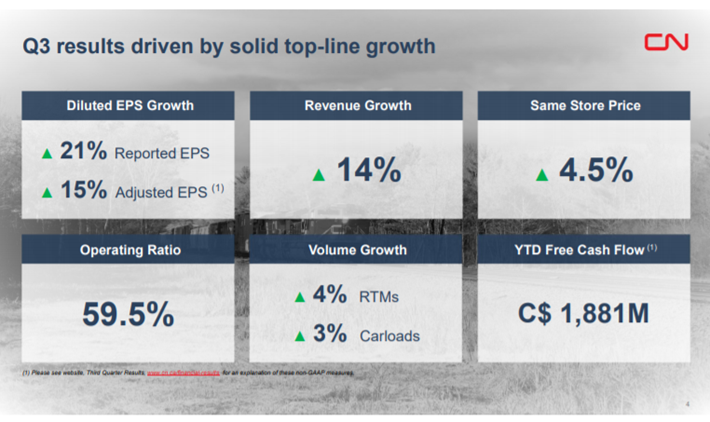
Source: Canadian National Railway’s Third Quarter Results Presentation, slide 4.
Canadian National Railway had adjusted earnings-per-share of C$1.50, beating the market’s expectations by C$0.03 and improving 14.5% from the previous year. Revenues were higher by 14.6% to C$3.7 billion. This was C$110 million above estimates.
Canadian National Railway’s operating ratio was 59.5%, an increase of 2.3% from the third quarter of 2017. While terminal dwell improved 1%, train velocity, car miles per day and train productivity all increased compared to the previous year. In addition, fuel costs increased 40%.
Revenue for all products shipped were higher year-over-year as Canadian National Railway was able to increase the price for freight. Volumes for some forms of shipments were lower however. Revenue ton miles increased 4% and car loads were up 3%.
Intermodal carloads were up just 2%, but revenue for this segment saw an 8% gain. Petroleum and chemicals saw a 5% increase in carloads and a 25% jump in revenues. Grain and fertilizers saw a spike in carloads of 8% to go along with a 15% revenue increase. Coal sales were up 25% on a 4% gain in carloads. Coal was a relatively small portion of Canadian National Railway’s third quarter carloads (5.6%) and revenues (4.6%).
Canadian National Railway reaffirmed its guidance for 2018. The railroad expects a midpoint for earnings per share for 2018 of C$5.375, which equates to US$4.11. If the company produces this total it would be an improvement of 7.6% from 2017. We expect EPS growth of 7% through 2023.
Canadian National Railway has increased its dividend for the past twenty-one consecutive years, giving it the longest growth streak on our list. The company has increased its dividend:
- By an average of 12.1% per year over the past three years.
- By an average of 14.8% per year over the past five years.
- By an average of 22.1% per year over the past ten years.
For the payment this past March, Canadian National Railway gave shareholders a 9.7% dividend increase. The stock has a yield of 1.7%. The company currently pays out $1.39 in dividends. Based off of expected EPS, this represents a payout ratio of just 33.8%.
Canadian National Railway’s shares recently traded at $81.01. Based off of the company’s expected EPS for 2018, the stock has a P/E ratio of 19.7. Canadian National Railway have traded with an average P/E ratio of 16.9 over the last ten years. If shares were to retreat to their average P/E ratio by 2023, the multiple could contract -3% per year.
We forecast that Canadian National Railway can offer a total annual return of 5.7% through 2023. This is based off our expected growth rate (7%), dividends (1.7%) and multiple reversion (-3%). Our previous estimate had forecasted 5.3% annual returns.
Canadian National Railway saw mid double digit growth on both its top and bottom line. The company’s dividend growth streak should reassure investors that Canadian National Railway is committed to paying and raising its dividend. We suggest investors looking to own a railroad wait for a pullback in share price before purchasing shares of Canadian National Railway.
Top Railroad Stock #2: Canadian Pacific (CP)
- Total Annual Return Potential through 2023: 10.3%
- Previous Railroad Rank: #2
Based in Calgary, Canadian Pacific operates 14,000 miles of rail in Canada and the U.S. Canadian Pacific, the second Canadian railroad on our list, was founded in 1881 and has a market cap of $28.5 billion. The railroad generated $6.55 billion in revenue in 2017.
Canadian Pacific released results for the third quarter on October 18th.
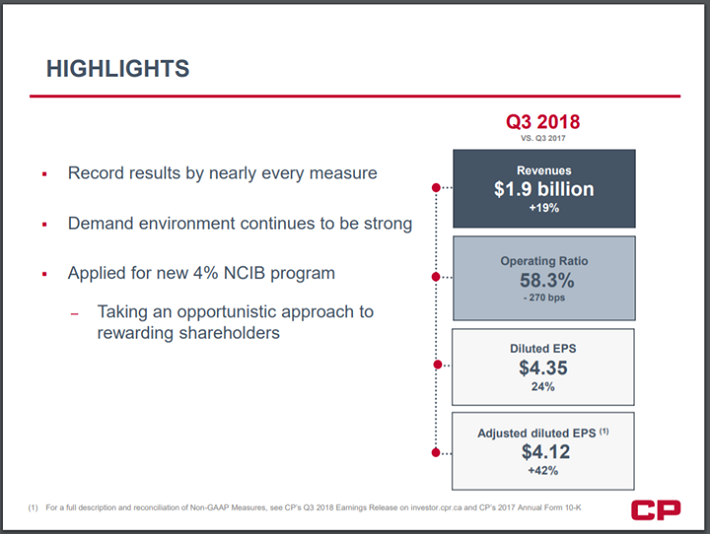
Source: Canadian Pacific’s Third Quarter Results Presentation.
Canadian Pacific’s adjusted-earnings-per-share were C$4.12, beating estimates by C$0.05. This was also a quarterly record for the railroad. Revenues increased 19% to C$1.9 billion, topping expectations by C$10 million. The railroad was able to improve its operating ratio to 58.3%, a company record and the lowest on this list.
Canadian Pacific saw across the board gains in product revenues.
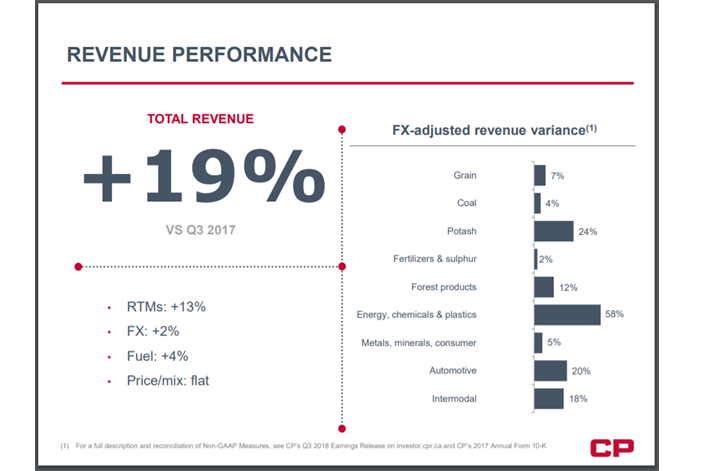
Source: Canadian Pacific’s Third Quarter Results Presentation.
Revenues from grain were up 7% on the back of a record shipment. Potash revenues were up 24% on record volumes. Energy, chemicals & plastics saw 58% growth, with crude shipments the primary factor. This category was still up 23% when excluding crude contributions. Lumber had its best quarter in a decade and was the driver of 12% growth for forest products. Automotive revenues were higher by 20%. New construction on Canadian Pacific’s auto compound in Vancouver is likely to be an opportunity for growth in this category for Canadian Pacific. Canadian Pacific saw some of the highest year-over-year revenue growth of any railroad we cover.
We expect that Canadian Pacific will earn US$10.61 per share in 2018, which would be a 22% increase from the previous year. We see the company offering annual earnings growth of 8.5% through 2023.
Canadian Pacific has increased its dividend in eight of the past ten years. The company has increased its dividend:
- By an average of 16.2% per year over the past three years.
- By an average of 3.8% per year over the past five years.
- By an average of 7.2% per year over the past ten years.
Canadian Pacific has paid out $1.93 in dividends-per-share this year. Using our expected EPS, this means the payout ratio would be 18.2%, the lowest payout ratio on our list. Shares yield 1.3% currently.
Shares of Canadian Pacific recently closed at $196 giving the stock a P/E ratio of 18.5 when using our expected EPS for fiscal 2018. The stock’s ten-year average P/E is 19. This would add 0.5% in additional yearly returns if shares were to expand to meet its historical average valuation by 2023.
In total, we forecast that Canadian Pacific can offer a total return of 10.3% per year through 2023. This growth expectation is arrived at by the combination of earnings growth (8.5%), dividends (1.3%) and multiple expansion (0.5%). Our previous estimate called for 8% annual returns.
Canadian Pacific offers our second highest estimated annual return. Investors may find Canadian Pacific attractive due to its potential double-digitt annual returns.
Top Railroad Stock #1: Kansas City Southern (KSU)
- Total Annual Return Potential through 2023: 12.9%
- Previous Rank: #1
Kansas City Southern, which has been in existence since the late 1880s, runs in a north-south direction and initially connected Kansas City, MO to Port Arthur, TX. The rail network consists of nearly 6,700 miles of track that connects Midwest and southern states to Mexico and ports along the Gulf of Mexico. A little more than half of revenues come from the U.S. with Mexico contributing the rest. The railroad generated $2.6 billion in sales in 2017 and has a current market cap of $10.3 billion. Kansas City Southern has the smallest market cap of all the railroads on our list.
Kansas City Southern reported third quarter results on October 19th.
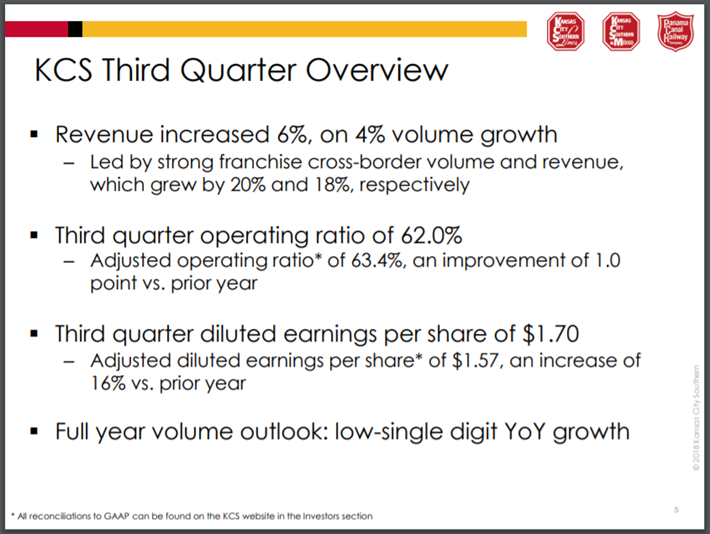
Source: Kansas City Southern’s Third Quarter Results Presentation, slide 5.
Kansas City Southern earned $1.57 per share, in-line with what analysts were looking for. This was an increase of 16.3% from the prior year. Revenue grew 6.5% to $699 million, but was $9.2 million below estimates. The railroad’s operating ratio improved 1% to 62%.
Kansas City Southern shipments were a mixed bag during the quarter.
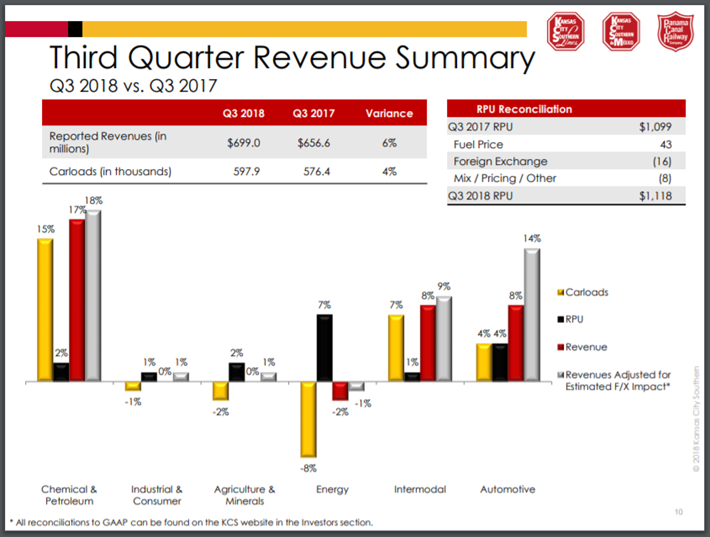
Source: Kansas City Southern’s Third Quarter Results Presentation, slide 5.
Chemicals & Petroleum shipments saw a carload increase of 15%, which was the main driver of 17% revenue growth. A 36% increase in petroleum sales were primarily responsible for this growth. Energy saw an 8% decrease in carloads, mostly due to volume declines of 25% in utility coal and a 35% drop in frac sand. Revenue per unit for energy shipments, however, were up 7% on a 223% increase in crude oil sales.
Kansas City Southern expects to earn $6.15 per share this year. This would be an increase of almost 19% from 2017. We believe that the railroad will grow earnings as a rate of 8.4% per year.
Kansas City Southern is a relatively young dividend paying company, with just six consecutive years of growth. The company has increased its dividend:
- By an average of 8.6% per year over the past three years.
- By an average of 18.2% per year over the past five years.
Investors should note that Kansas City Southern hasn’t increased its dividend since the October 2017 payment. The stock yields 1.4%. The company will pay out $1.44 in dividends-per-share. Using the company’s EPS guidance, Kansas City Southern has a payout ratio of 41.9%. This is the highest payout of the major railroads.
Using the recent closing price of $100.36 and expected EPS, shares of Kansas City Southern trade with a multiple of 16.3. This is the cheapest valuation in the sector, likely due to rhetoric between the U.S. and Mexico. Now that a potential deal has been worked out, we feel this issue has been lessened.
The company’s ten-year average P/E of 22.7 is among the highest on our list of railroads. We maintain a 2023 target P/E of 19. If shares were to expand to a P/E of 19 from their current level of 16.3, then shareholders would see an additional 3.1% in annual returns over the next five years.
We project that Kansas City Southern can offer a total return of 12.9% per year through 2023. This projection is based off growth (8.4%), dividends (1.4%) and multiple expansion (3.1%). Our previous estimate had predicted 11.5% annual growth going forward.
Kansas City Southern is our favorite among the railroad companies. Potential issues over trade with Mexico appear to have been addressed. Kansas City Southern offers a solid combination of growth and multiple expansion. We encourage investors looking for exposure to this sector to consider adding Kansas City Southern.
Thanks for reading this article. Please send any feedback, corrections, or questions to support@suredividend.com.
ValueWalk readers can click here to instantly access an exclusive $100 discount on Sure Dividend’s premium online course Invest Like The Best, which contains a case-study-based investigation of how 6 of the world’s best investors beat the market over time.
Article by Nate Parsh, Sure Dividend

