
Emerging markets have taken a beating this year on the back of softer China growth, the trade wars, a stronger USD, and Fed tightening… along with a few idiosyncratic issues (Turkey, Argentina, et al). While I think EM still faces a number of headwinds in the short term I wanted to highlight a few longer term charts on the representation of emerging markets on the global economic stage, global equity markets, and portfolio allocations.
[buffett]
Q2 hedge fund letters, conference, scoops etc
There’s a lot of debate around emerging markets, even with issues like what’s the difference between EM and DM, And invariably EM assets fall in and out of favor through the cycle like any freely traded asset market. But there are a couple of key structural trends that don’t appear likely to change any time soon, and will only continue to grow in importance.
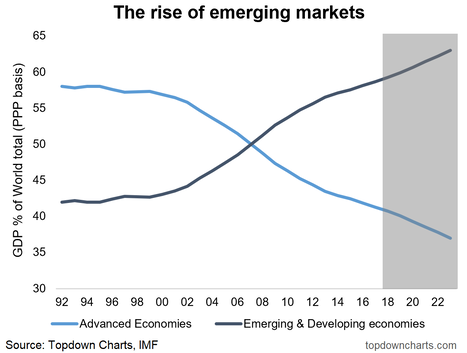
- EM vs DM – Share of World GDP: First of these key trends is the rise of emerging markets on the global economic stage. Around the time of the financial crisis, not only was there great upheaval in global financial markets, but there was a perhaps little noticed moment of history where emerging markets took the lead. From about 2008 onward EM took over as the dominant share of world GDP. This is a key event in economic history and will have wide reaching implications for the path of economic growth, volatility, and capital market opportunities.
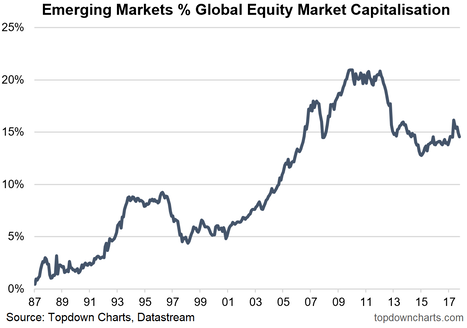
- EM vs DM – Global Equity Market Cap: Which brings us to the next chart, which shows emerging market equities as a proportion of global equity market capitalization. Though EM economies account for more than 55% of global GDP, EM equities account for less than 15% of world equity market cap. You can clearly see on this chart the trend, and this trend will continue. But you can also clearly see the cycle around that trend – and it’s these cycles that create opportunities for active asset allocators.
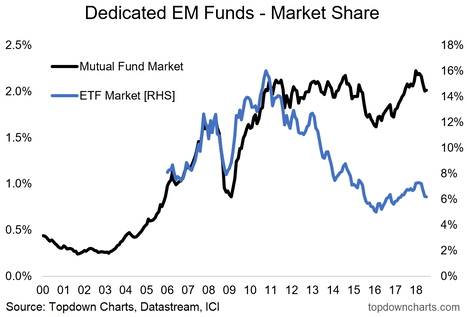
- Market Share of Funds and ETFs: With factors like quantitative tightening weighing on emerging markets, the share of EM funds as a percentage of all mutual fund and ETF assets has slipped (both market movements and flows effects). While you probably expect these to grow over the long run, these sort of proxy asset allocation indicators also carry sentiment signals. To that end, I think we probably need to see a further move down in the mutual fund market share indicator before that produces a more compelling signal.
To conclude, the economic and financial market influence of emerging markets is clearly rising, and the longer term trends look set to continue (rising share of the global economy and global asset markets). Yet the cycle around this trend creates opportunities, and should the short term trends continue it will create a compelling contrarian cyclical opportunity for emerging market equities.
Article by Callum Thomas, Top Down Charts

