
One of Small-Cap’s Worst Quarters in 40 Years
Just how bad was the correction in 2018’s last three months when the small-cap index declined 20.2%? This decline’s depth, breadth, and downward velocity were all notable, if not historic. Within the Russell 2000 Index, 89% of the companies had a negative 4Q18 return—while in the famously bearish 4Q08, “only” 87% did.
Q3 hedge fund letters, conference, scoops etc
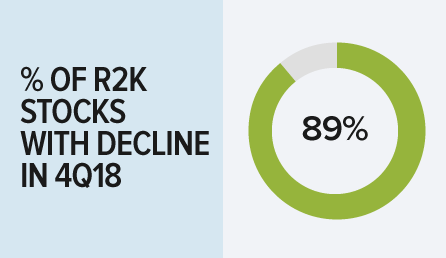
2018’s final quarter was not only one of the deepest declines ever in the 40-year history of the small-cap index (just six quarters over that 160-quarter span had worse results), but also among the broadest. Only three other quarters—4Q87, 3Q90, and 3Q11—exceeded that 89% figure.
If you’re looking for more timely hedge fund insight, ValueWalk’s exclusive newsletter Hidden Value Stocks offers exclusive access to under-the-radar value hedge funds and their ideas. Click here to find out more and signup for a free no-obligation trial today.
Volatility also surged in the quarter as 54% of the trading days for the Russell 2000 had intraday moves of at least 1%, compared with 22% during the year’s first three quarters. Of course, U.S. small-caps did not suffer alone. It was a volatile and bearish fourth quarter for stocks of all sizes, all across the globe.
2018: A Tale of Two Markets
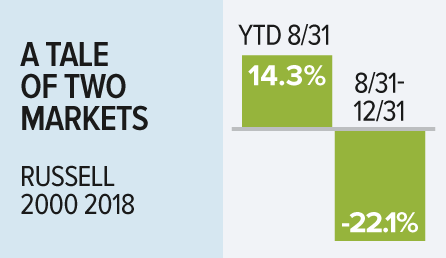
Its tumultuous last four months made 2018 a truly schizoid year. The index’s full-year return of -11.0% was a tale of two markets in which the first eight months saw a bullish, mostly smooth period of steadily rising share prices. Yet once the Russell 2000 made a new all-time high on 8/31/18 (with a YTD return of 14.3%), small-caps began to give back their calendar-year gains, though YTD as of 11/30/18, small-caps were still up 1.0%.
The downward trend picked up most of its momentum in December, when the Russell 2000 fell 11.9%. By year-end, all 11 of the Russell 2000’s sectors were in the red for 4Q18 while 10 were negative for the year as a whole (only Utilities managed a positive return). Commodity-based cyclicals sectors Energy and Materials finished with the biggest declines for 4Q18 and the calendar year while Health Care and Industrials also endured large losses in the quarter. Altogether, 10 sectors suffered double-digit losses for the quarter, and five—Energy, Financials, Industrials, Materials, and Real Estate—had double-digit losses in 2018 as a whole.
A Deep-And Deeply Puzzling-Decline…
2018’s widespread losses were not limited to the U.S.; the vast majority of international markets also saw declines. The global equity markets hadn’t seen anything quite like 2018 since 2008-09 and 2011. Yet in each of these cases, there was an obvious catalyst. In the first instance, the world was in the grips of a recession and reeling from the effects of the Financial Crisis; in 2011, the fear of recession was lingering like a virus feeding on the after-effects of the Crisis. Previous small-cap declines, including those in 2001-02 and 1998, were also accompanied by recessions or international financial crises.
Today, while the risks of recession are real enough, at year-end they were no more than that. So we think it’s worth emphasizing that nearly all declines of 20% or more for small-cap stocks have been accompanied by economic recessions, profit recessions, or a financial crisis—and that none of those conditions were present in 2018.
In fact, most economic measures remained solidly positive, even as they decline from what look like peak levels. There have been indications of a slowing pace in housing, autos, and more recently in consumer confidence. Some regional Federal Reserve outlook surveys have also revealed signs of a slowdown—though not a contraction.
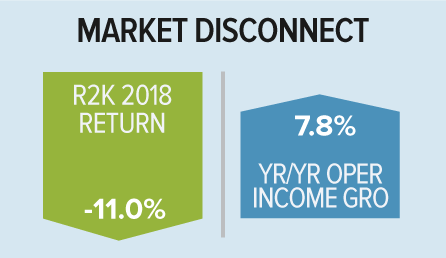
Equally important, there is a disconnect between year-over-year operating income growth and 2018 returns for small-cap stocks that indicates the ongoing presence of a key fundamental strength that appears to have been missed during the sell-off.
…With a Familiar Pattern
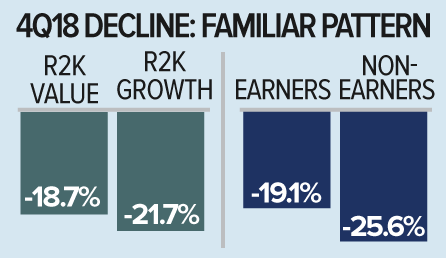
In most ways, however, the downturn has had a familiar, albeit unpleasant, feel: small-caps have lost more than large-caps, for example, which is consistent with many bear markets, as is the fact that small-caps entered bear market territory—a decline of 20% or more—before their larger counterparts.
Within small-cap, we have also seen value beat growth, dividend payers lose less than non-payers, earners hold up better than non-earners, and defensives so far outpace cyclicals. All of this is also essentially consistent with history.
The fact that the array of returns within small-cap fits the historical pattern is reassuring (though painful in the short run). It also bolsters our confidence in what we expect will follow.
Recession or Risk Re-Set?
At the end of 2018, the markets appeared priced for the grim scenario of recession, whether domestic or, for the first time in U.S. history, imported from combined slowdowns in China, Europe, and Japan. While a recession or significant economic slowdown in 2019 is certainly possible, we want to stress instead how the recent pullback seems driven by expressly fatalistic interpretations of data.
Our misgiving about the likelihood of recession, whether homegrown or imported, is rooted in the fact that the level of market turmoil we have seen simply doesn’t match the economic data. While the important economies of China, Europe, and Japan have slowed down appreciably, none are in recession.
Similarly, our issue with the sell-off being motivated by anxiety about yield-curve inversion is that, while inversions have been as sure a signal of recession (though not a cause) as history offers, the two- and 10-year have yet to invert. And when the curve has inverted previously, the economic contraction has been as far as 20 months into the future.
As bottom-up small-cap stock pickers, we rely more on what we see and hear about the companies we own than on macro data and trends. On that basis, we believe that economic and earnings growth are likely to slow—but not contract—in 2019. What we hear from management teams, the industry analyses we conduct, and ISM data all suggest a measured optimism—and certainly not panic or capitulation.
4 Reasons to Like Small-Cap Now
- 2018 was the 12th negative calendar year for the Russell 2000 in its history. In 10 of the previous 11, a positive calendar-year return followed—with an average one-year return of 21.1%. (The lone exception was 2007-08.)
Is a Decline in the Russell 2000 a Buy Signal?
Russell 2000 Declines and Subsequent Calendar Year Performance of as of 12/31/18 (%)
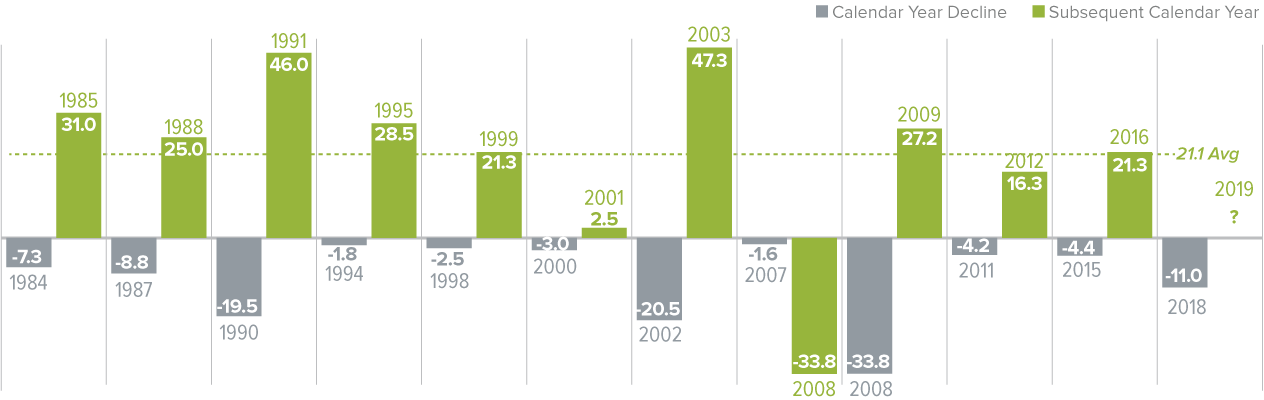
- Looking at the current bear period from a market cycle perspective shows a similar result. This past year marked the 11th decline of 20% or more from a previous small-cap peak. In nine of the previous 10 periods, the subsequent average one-year return from the first day in which the index declined 20% from its peak was a positive 19.4%. (The exception, again, was 2008-09). These historical examples suggest the strong possibility of a solid 2019.
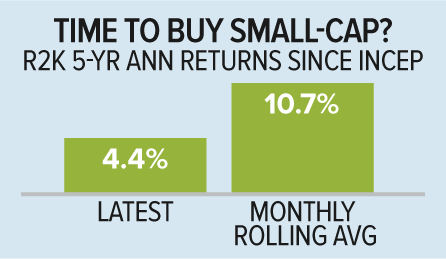
- The five-year average annual total return for the Russell 2000 as of 12/31/18 was 4.4%. After running higher for several quarters, this five-year result is now comfortably below the small-cap index’s five-year rolling monthly average of 10.7%. This shift encourages our belief that, for the first time in several years, the next five years will be better than the last five for small-cap investors—in particular active small-cap investors.
- Small-cap valuations are now much more reasonable. Due to the appealing interplay of the price declines for small-caps and an increase in their profits, the resulting Russell 2000 valuation, based on our preferred EV/EBIT metric (median ex-negative earnings), dropped from 19.5x on 12/31/17 to 16.4x at 12/31/18.
Our take is that small-cap returns were loftier than what the fundamentals could support earlier in the year when the Russell 2000 was trading at record highs despite having a large number of companies with ample debt and/or no earnings. During 4Q18, it seemed as if the market overcorrected in a particularly manic fashion, to the point where fundamentals, such as growing operating income, are in many cases stronger than what valuations would indicate.
The Opportunity for Active Managers – Putting Cash to Work
While bear markets create more than their share of challenges, as active managers we are grateful to have ample down market investment experience across our portfolio management staff. We think that deep knowledge about the dynamics of previous corrections matters.
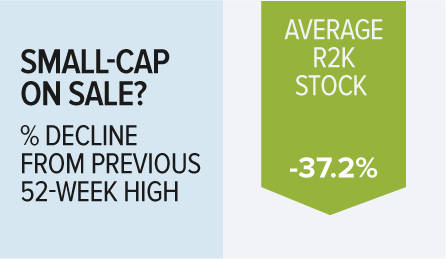
Throughout the correction—across all of our strategies—we’ve been seeking to take advantage of attractive long-term buying opportunities across a broad spectrum of sectors and industries, including companies involved in energy services, RV parts, infrastructure, laser-based photonics, trucking, banking, outpatient healthcare facilities, and semiconductor capital equipment. For a sense of the attractive price levels created by the correction, consider that the average stock in the Russell 2000 declined 37.2% from its previous 52-week high through 12/31/18.
We have been buying more of the companies that we know best and in which we have the highest confidence in their proven ability to deal effectively with adversity.
As we set out in 2019, we are confident in these holdings, as they generally have solid cash flows, modest valuations, effective managements, and encouraging prospects. These businesses look most likely to weather the more volatile and uncertain environment in which we find ourselves.
Article by Royce Funds

