
As the Fed is steadily progressing through its balance sheet normalization plan, it’s worth checking in on a few charts that highlight the path to normalcy, and some of the potential stumbling blocks along the way. This article provides an update and follow on from a previous post “5 Charts on Quantitative Tightening“.
[timeless]
Q2 hedge fund letters, conference, scoops etc
The beginning of large scale asset purchases (or QE – Quantitative Easing) in the wake of the financial crisis was a grand monetary policy experiment, and we are now entering into another grand monetary policy experiment which will test portfolio managers and asset allocators.
Already we have seen plenty of examples of how Fed tightening is presenting ripple effects across global markets, with a stronger US dollar and higher interest rates putting stress on emerging markets, shaking commodities, and presenting more uncertainty for stock prices and bond yields. Given the importance of monetary policy for the economic and financial market outlook, this is a topic worthy of your attention.
The key takeaways on quantitative tightening (or QT) are:
- QT is set to rise from a current potential $40B per month to $50B in Q4 this year.
- All else equal QT is likely to be a headwind for both stocks and bonds, and a tailwind for the USD.
- Globally the ECB and BOJ are providing some offset, but will each be heading for the exits at some point too.
- Some of the most profound impacts are likely going to be known only in hindsight, as we enter uncharted territory.
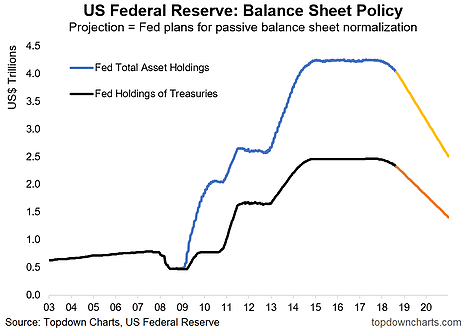
1. Fed Balance Sheet Normalization Plan: As outlined in the Fed’s plan for balance sheet normalization, the Fed has embarked on a progressive quantitative tightening program whereby it will allow its balance sheet to be run down over time. The chart below shows approximately how this will play out (all going to plan). Currently the monthly pace of QT is a potential $24B in treasuries and $16B for asset backed securities (combined $40B), all going to plan, this will rise to $30B in treasuries and $20B in ABS (combined $50B) in Q4 this year. For context, at its height QE3 was running at a pace of $85B per month, so the pace of balance sheet shrinking will not be too far off the pace of expansion back in the days of experimental easing.

2. Cumulative Amount of QT Undertaken: Since commencing Quantitative Tighteningtotal assets have been reduced by over $220B, and of that holdings of treasuries have been reduced by $140B in total. Thinking about this chart and the previous chart, and the traditional policy tool of the Fed funds rate, I can’t help but wonder if there may be a “neutral level of the balance sheet”, just like there is the concept of a neutral Fed funds rate… because there will come a time when the Fed will reduce the pace of balance sheet shrinking or even stop altogether should the out-turn of the economic data justify this. As a very rough stab, I would suggest perhaps a return to 2012 levels of the balance sheet as a potential end point in the Fed’s initial balance sheet normalization journey.
3. Quantitative Tightening vs Bond Yields: As mentioned in a previous post, the commencement of QT coincided with the start of a reasonably sizable move in US 10-year bond yields. There are of course many factors that come in to play for bond yields (namely inflation, economic growth, etc), but from a flows standpoint less reinvestment means less purchases, and balance sheet rundown means less holdings locked out of the market on the Fed’s balance sheet. So all else equal, QT should drive yields up at the margin. The unanswered question is how great an impact this will have on bond markets vs the traditional drivers. All I can say for certain on this issue is that we should expect fundamental driven selloffs in fixed income to be more pronounced as Fed balance sheet reduction progresses.
4. QT vs the S&P500: Depending on who you ask, QE had either little impact or a major impact in driving stocks higher over the past 10 years, and if QE was helpful, then it stands to reason that QT will be harmful. As the pace of QT steps up through this year, the S&P500 could end up on the receiving end of the completion of this grand monetary policy experiment as the Fed comes full circle in its balance sheet policies. Having said that, the total or net policy picture is probably helped by the tax cuts and potential for further tax cuts, with the long term earnings outlook for the S&P500 looking the best in more than a decade.
5. QT vs the US Dollar: One of the most intriguing potential effects of quantitative tightening is going to be how it affects the US dollar. For an asset allocator or global macro investor the path of the US dollar is so critical because it creates such profound and direct impacts across much of the world’s major financial markets and asset classes. It may be an oversimplification, but “tell me what the US dollar is going to do, the rest is noise” is probably close to a fair statement. Given we have limited history in this experiment it’s hard to say with certainty what if any impact QT will have on the US dollar, but from a monetary/quantitative perspective, all else equal it should be a tailwind. The chart below points to the US dollar index, or DXY, potentially strengthening to over 100. I still see upside risk for the US dollar, and this is one of the things I’m looking at
6. Global Central Bank Balance Sheet Expansion: Now for some global context;the major QE banks (The Fed, ECB, and BOJ), are actually all headed in the same direction. Although its worth noting that with Europe and Japan the balance sheets are still very much expanding, but just at a slower pace. For now this is providing some offset against Fed QT at a net global level, but the question is for how long… The ECB has explicitly tapered and the BOJ has tapered by stealth, taking further steps toward tapering in its most recent meetings. The picture becomes all the more complex as you throw in further tightening across the globe. And as the next chart shows, EM central banks are likewise being dragged down the tightening path too, so for this year and particularly 2019 the big challenge is going to be the turning of the tides in global monetary policy.
7. Fed tightening and Emerging Markets: As alluded to, emerging markets have been on the receiving end of Fed tightening, with the impact of higher rates, balance sheet reduction, and a stronger US dollar driving tighter financial conditions for emerging market economies. Indeed, as the chart below shows, the effective tightening undertaken by the US Federal Reserve is starting to drag emerging market central banks down a path of tightening (with currency defense a key driver, and higher inflation another factor as EM currencies come under pressure). So I think it’s fair to say that as the Fed moves further down the tightening path, both in terms of interest rates and the balance sheet, it’s going to present more of a headwind for emerging markets (and likely by extension, commodities as well – particularly with the outlook for the US dollar).
That’s all for this update, I hope you found it useful and thought provoking – I will likely do another update later in the year as the grand monetary experiment progresses, and the global monetary tides shift further. Be sure to follow us for this and other updates, or even explore becoming a client for deeper insights.
Article by Callum Thomas, Top Down Charts

