
“Monetary tightening by central banks is like trying to pull a brick across a rough surface with elastic: nothing happens; still nothing happens; then it leaps up and hits you in the face.”
– Ambrose Evans-Pritchard, The Telegraph
Q3 hedge fund letters, conference, scoops etc
On My Radar is a letter about risk and opportunity. I’ve been writing all year that we sit late in an economic expansion cycle, the global system is over leveraged and the equity markets are overvalued by almost every meaningful measure (though a little better after the recent pounding). The hard part about investing is we feel opportunity is best when risk is actually at its highest and opportunity is at its worst when risk is at its least. Our human tendency is to project recent good portfolio performance forward.
The greatest opportunities come in crisis, and crises generally materialize in recessions. Fear reaches extreme, panic selling takes form, margin calls kick in and any remaining buyers back away. Yet that’s when the best opportunities present themselves. The single best piece of advice I was ever given came from the great Sir John Templeton. He said, “The secret of my success is I buy when everyone else is selling and I sell when everyone else is buying” and he added, “It will be one of the most difficult things for you to do.”
I believe we hit a short-term fear bottom but our initial starting conditions have hardly improved. I pointed that out in Wednesday’s “Trade Signals – Record Extreme Pessimism, Expect a Rally” citing investor pessimism reached the lowest since 1995 and lower than anytime during the Great Financial Crisis. This is as extreme as it gets. Expect a rally. And we may rally for several months. However, I don’t think we are out of the woods as the economic expansion is now 115 months old (2009 through December 2018), the second longest in history. In comparison, the longest expansion lasted 120 months (1991-2001), the expansion post the great Tech bubble lasted 80 months, and the average for more than 100 years is 40 months. All expansion cycles end with a recession. This one is aged and odds favor a 2019 recession. Keep an eye on the recession indicators posted in Trade Signals each week. Currently, there is no immediate sign of a recession.
Recessions reset the system. Weak companies default, pricing power for the strong is corrected, and a new expansion cycle begins. Zero interest rate policy has enabled record high debt. Excessive leverage is the telltale sign.
I’m on record saying the coming opportunity in high yield and other areas of distressed debt will be epic. But “distress” won’t appear until liquidity is yanked from the system. I believe we are in the early innings of the yank. Add to the risk pile near-record high valuations, near-record high individual investor exposure (as a percentage of their household wealth) to stocks (“all in” as the say), record corporate share buybacks largely behind us, and central bankers pulling the punch bowl away. For an investment advisor to not be risk focused at this stage in the cycle is imprudent. A bear market has begun though I don’t believe we are anywhere near a Sir John Templeton “buy” moment. That remains ahead and it likely presents in the next recession. Always does.
Several things caught my eye this week that I’d like to share with you… things to keep “on your radar.” You’ll find them when you click through below. For example, John Murphy from StockCharts.com took a look at the last two Fed rate hike cycles and noted that previous instances of Fed tightening were accompanied by rising commodity prices, yet in this cycle the Fed is raising rates while commodity prices are plunging. He suggests that “cash may be the new king.” Also included is a chart from Murphy’s website showing a probable bear market bounce to the S&P 500 2600 level. It’s a thoughtful review of what the early stages of a bear market look like. Market tops tend to roll over and demonstrate a series of lower lows and lower recovery highs. I believe this is the pattern we are seeing today.
Lastly, I share an important piece from the ever blunt Ambrose Evans-Pritchard. We all know that the leverage in the system has never been greater but what we don’t all have insight into is the additional leverage that exists in derivative products. I was blown away to see nearly $500 trillion in derivative exposures. You’ll find my summary of his post along with the link to his writings at The Telegraph. It’s worth the nominal subscription fee.
Evans-Pritchard cites the Bank of International Settlements, the world’s top central bank watchdog, warns the pillars of the global financial system are fundamentally unstable and could lead to a frightening chain reaction in the next crisis. I agree! Take a deep breath before reading. Just saying…
I sure hope your holidays have been wonderful. Grandma Pat joined us for a week and, boy, did we enjoy her company. Somehow she has the Sir John Templeton gene. She reads my piece each week and asks for my advice but I just tell her to keep doing what she’s doing. The Christmas dinner table discussions were lively. Powell firing a knuckleball at Trump and Treasury Secretary Steve Mnuchin yelling fire (unknowingly or knowingly) on the most illiquid day of the year… well, you just can’t make this up. I told the family it’s going to get even bumpier in 2019. Buckle up. Our risk management processes are working, to which I’m grateful. I hope yours are as well!
Happy New Year! Grab that coffee and find your favorite chair. I hope you find the balance of the post helpful. Remain defensive.
I hope you find this week’s post helpful.
♦ If you are not signed up to receive my weekly On My Radar e-newsletter, you can subscribe here. ♦
Follow me on Twitter @SBlumenthalCMG
Included in this week’s On My Radar:
- John Murphy: Cash May Be the New King
- A History of Early Stage Bear Markets
- Ambrose Evans-Pritchard: BIS fears financial seizure at the heart of the world’s clearing system
- Trade Signals – Record Extreme Pessimism, Expect a Rally
- Personal Note – The Best Christmas Ever (SNL)
John Murphy – Cash May Be the New King
PREVIOUS INSTANCES OF FED TIGHTENING ACCOMPANIED RISING COMMODITY PRICES — THE FED IS RAISING RATES NOW WHILE COMMODITIES ARE PLUNGING — WEAK CHINESE MARKET IS PULLING COMMODITIES LOWER — AND REFLECTS A SLOWING GLOBAL ECONOMY — U.S. STOCKS ENTER BEAR MARKET — CASH MAY BE THE NEW KING
By John Murphy
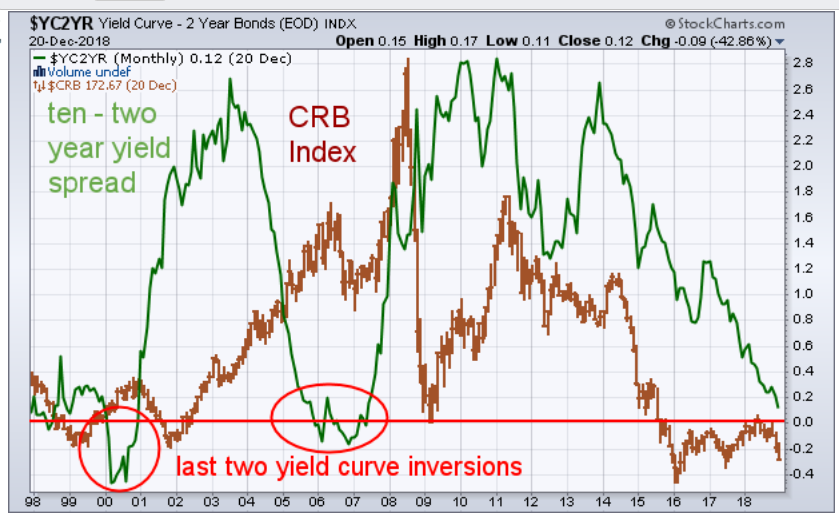
LAST TWO YIELD CURVE INVERSION RESULTED FROM RISING COMMODITY PRICES … My Wednesday morning message suggested that a sharp drop in the price of oil and other commodities argued for a more dovish tone from the Fed. That message also explained that previous Fed tightening cycles were usually done to combat rising inflation and higher commodity prices. Let’s take a look at the two most recent times that happened. Chart 1 compares the CRB Commodity Index (brown bars) to the spread between ten and two year Treasury yields (green line) over the last twenty years. That period includes the two recent yield curve inversions that took place during 2000 and again in the period between 2006 and 2007. Both yield inversions are marked by red circles and occurred when the ten-year yield dropped below the two year (which pushed the spread below zero). The chart shows commodity prices rising in both instances. Both times the Fed raised short-term rates to slow the commodity price advance.
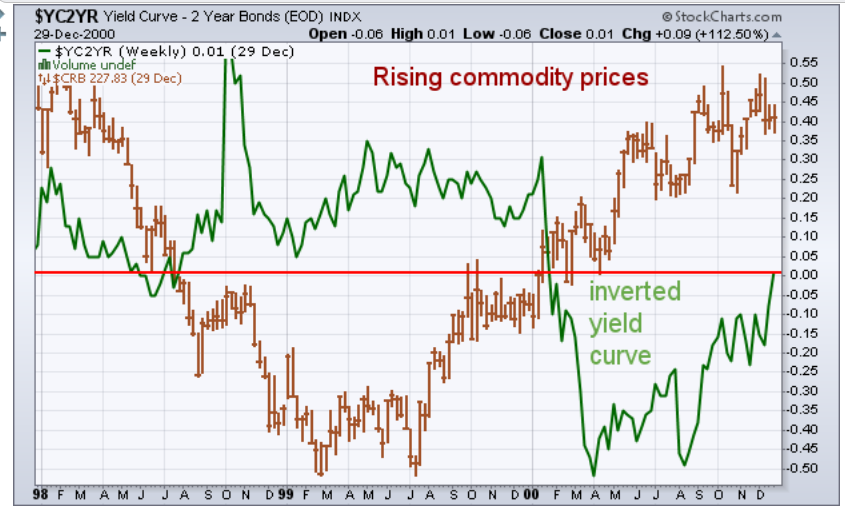
RISING COMMODITY PRICES LED TO 2000 YIELD INVERSION… The green line in Chart 2 shows the ten – two year yield spread falling below zero near the start of 2000 (when the ten year yield fell below the two year). The rising brown bars show commodity prices (including oil) rising sharply during the second half of 1999 which encouraged the Fed to raise short-term rates to slow the inflation threat. That led to the yield inversion near the start of 2000. In case you don’t remember, the Nasdaq peaked in the spring of that year and the S&P 500 that October after which the economy entered a recession the following spring.
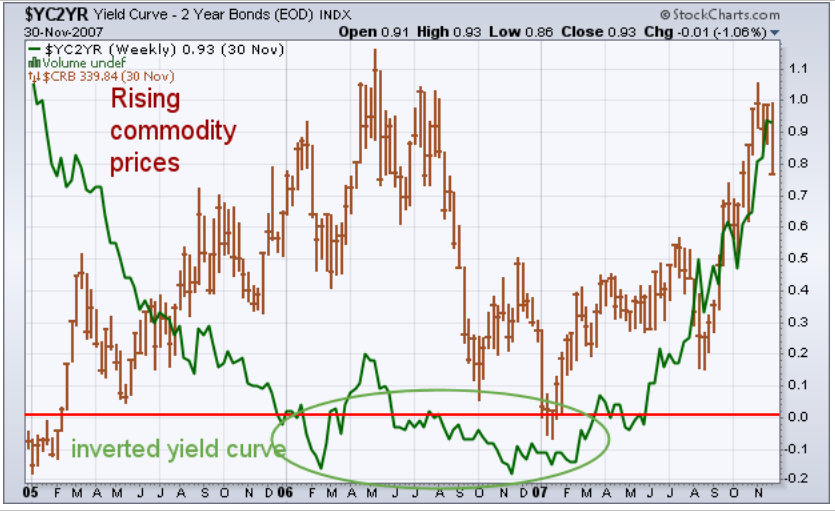
RISING COMMODITIES ALSO CONTRIBUTED TO 2006 INVERSION… Chart 3 shows the most recent yield curve inversion between the ten and two year Treasury yields taking place near the start of 2006 and lasting into the start of 2007. There again, rising commodity prices during 2005 and the first half of 2006 encouraged the Fed to raise short term rates enough to push the two year yield above the ten year and pushed their spread below zero (green circle). And that inversion helped set the stage for the stock market peak in October of 2007. That in turn preceded the start of the last recession that started two months later in December of that year. [For the record, commodity prices kept rising into the middle of 2008 before finally peaking. If you take another look at the brown bars in Chart 1, you’ll see that commodity prices have been in decline since then.
Which brings us to 2018.
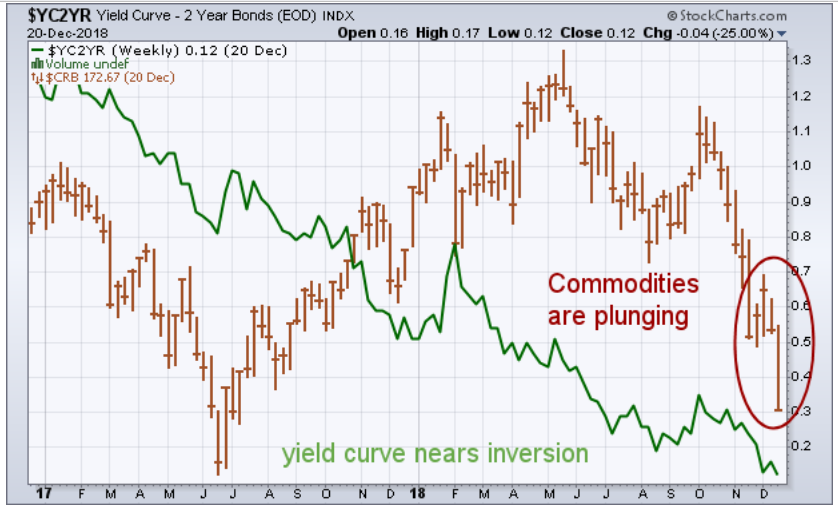
COMMODITY PRICES ARE PLUNGING THIS TIME… Chart 4 compares the same ten – two year yield spread (green line) to the CRB Commodity Index (brown bars) over the last two years. Two things are different in Chart 4. First of all, the yield curve hasn’t inverted yet. The ten year yield is currently 12 basis point over the two year. That’s the lowest level in more than a decade (since 2007), but is still positive. The second thing that’s different this time is that commodity prices are plunging (brown circle). This is the first time I can recall the Fed raising rates in the face of falling commodity prices in the fifty years that I’ve been charting the markets. Which kind of makes me wonder what the Fed is thinking. It kept rates historically low over the past decade in an attempt to lift the global economy out of a deflationary spiral by boosting inflation. More rate hikes could weaken commodity prices even more which threatens recent progress on achieving 2% inflation. A strong dollar resulting from more rate hikes would also weaken commodity prices in the coming year. At the same time, boosting short-term rates (while bond yields are falling) could itself cause the yield curve to invert which could threaten the U.S. economy. So could lower commodity prices resulting from reduced foreign demand. The Wall Street Journal points that two-thirds of foreign commodity demand comes from emerging Asia, and most of that from China.
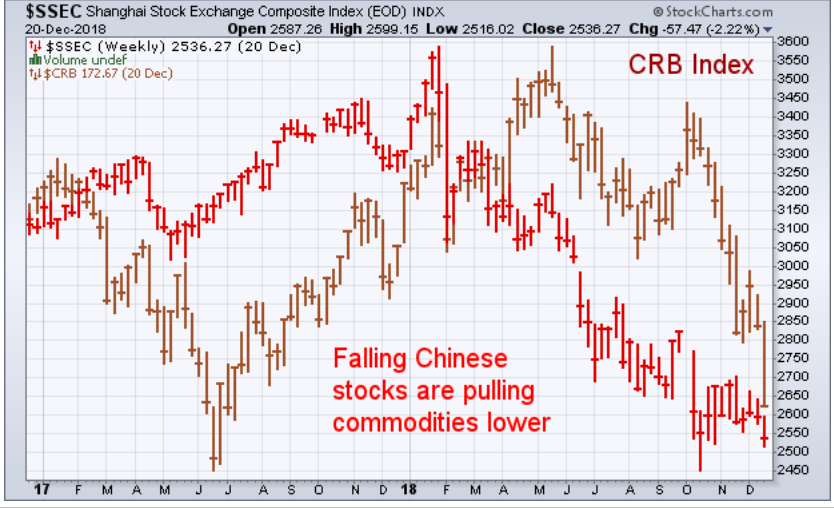
WEAK CHINESE STOCKS ARE PULLING COMMODITY PRICES LOWER… Nothing happens in a vacuum. A lot of what’s happening in the U.S. financial markets is being influenced by deteriorating conditions in foreign markets. Like China. The red bars in Chart 5 show the Shanghai Stock Composite Index in sharp decline this year. In fact, it has lost -28% from its January high which qualifies as a bear market. That reflects weakness in that country’s economy which is the second biggest in the world. And that’s bad for commodities. The brown bars in Chart 5 show commodity prices following Chinese stocks lower. That’s because China is the world’s biggest buyer of those commodities. It’s also worth noting that the two weakest commodity groups this year have been energy and industrial metals. Both are considered bellwethers of the global economy. And right now they’re sending a message of global weakness. The U.S. is part of that global economy. Shouldn’t economists be factoring that into their rosy forecasts for next year?
U.S STOCKS ARE NOW IN A BEAR MARKET … This week’s drop by all major stock indexes below their early 2018 lows confirms that U.S. stocks have entered a bear market. Some parts of the market have already crossed the -20% threshold which also defines a bear market. They include small caps stocks and the transports, while the Nasdaq may be there by the end of the day. The energy sector has already lost dropped more than -20%, while several other sector SPDRs are dangerously closer to that bear market threshold which include consumer cyclicals, financials, industrials, materials, technology, and communications. Cash is usually the best place to hide in that weaker environment. What’s unsettling is that the Fed (and most economists) don’t seemed that concerned. They keep assuring us that the U.S. economy remains strong. But what about the negative impact from weaker foreign economies? If your best customers are losing their jobs, your company is in trouble. If foreign economies weaken, who’s going to buy our exports?
Bottom line (SBB here: My personal view): The Fed is stuck between a rock and a hard place – needing to get interest rates up to save off a deeper pension crisis. The unintended consequence of zero interest rate policy and overly optimistic actuarial return estimates has created a pension crisis. Raising rates in the face of a slowing economy and free fall in commodity prices is opposite what we saw in the late 1970s and early 80s, late 1990s and mid-2000s. Something is different here. The global economy is in recession and the U.S. will likely follow in 2019. The Fed is way behind the eight ball.
Bottom line line: More defense than offense until the Great Reset sets up the next great buying opportunity.
A History of Early Stage Bear Markets
This section gets a little quant geek. Tom Bowley compares bear market behavioral tendencies of periods past which may give a glimpse of what to look out for going forward. Bottom line: Expect sharp recover bounces but overall a period of lower highs and lower lows. We are in the early stages of a new bear market. Also note in the second chart below how volatility spikes correlate with short-term trading lows. That is the case with the market activity this past week.
Support Has Been Established, Now How High Might We Bounce? By Tom Bowley | December 27, 2018 Source
Market Recap for Wednesday, December 26, 2018
After gapping higher on Wednesday, the major indices retreated initially to lose all of its opening gains. The Dow Jones traded approximately 300 points higher right out of the gates, but within 90 minutes had lost those gains and were down 80 points. I’m sure most everyone was thinking “Here we go again!” But this time, buyers emerged and the Dow Jones went on to post historic gains. By day’s end, the Dow Jones finished higher by 1,086 points, or 4.98%. It’s had higher percentage gains before, but never such a point gain. It would be so much better if these gains had occurred because of something fundamental that might last. Instead, however, it was simply a massive relief rally from the worst December on record.
Volatility ($VIX) had reached an extreme level at Monday’s close when it finished just above 36. As I posted previously, the VIX had hit 37 and 34 during the initial price breakdowns in the two previous bear markets. That was a clear indication to me that we were at or nearing a major bear market bottom. Unfortunately, it’s not likely to be the final one. We have to start somewhere, though, and it’s nice to have a price support level to monitor as we move forward. Here’s what we should be watching in the coming days, weeks and months:
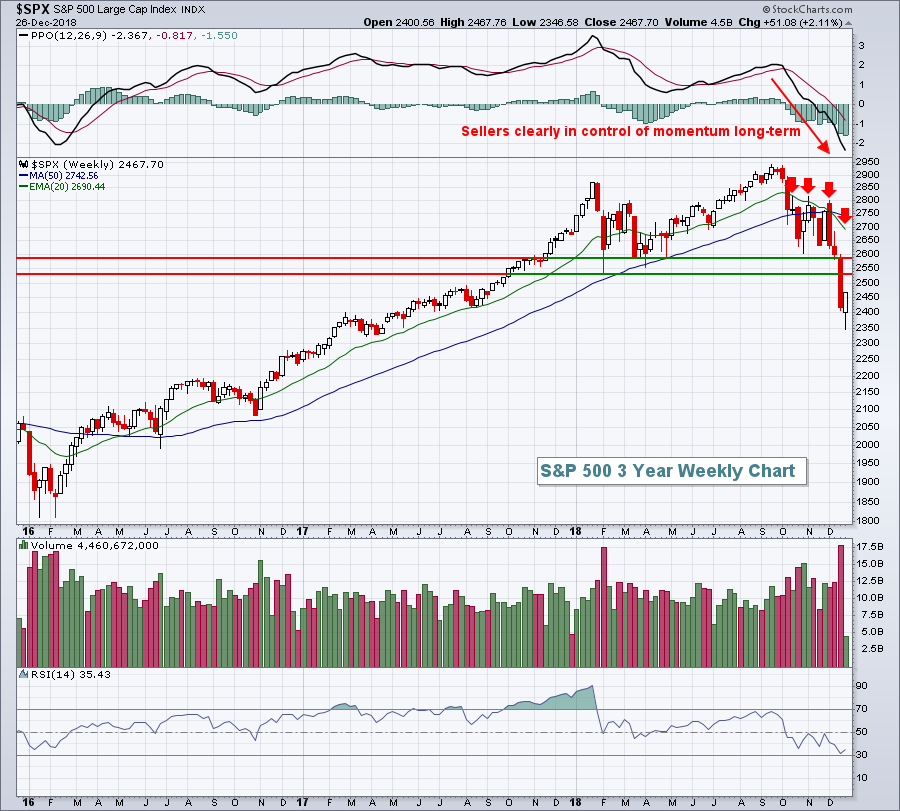
On this longer-term weekly chart (above), the S&P 500 bears will have multiple defenses. The obvious defense is price resistance. Previously, 2581 had marked closing price support on the daily chart and 2532 had marked intraday price support. So that range to the upside, 2532-2581, will provide key overhead resistance. The declining 20 week EMA is at 2690, but will be dropping rapidly. The combination of these three price levels will be most interesting to watch, along with VIX readings of course. I would expect another round of selling before the VIX ever drops below 20. That has been the history of early stage bear markets.
There’s not really any reason to highlight individual sectors on industry groups as just about every area of the market bounced because it was extremely oversold. Suffice it to say that all 11 sectors were higher and every industry group was higher, except for gold mining ($DJUSPM, -0.43%). The DJUSPM, however, looks very solid and one of the few areas that I’d buy from a technical perspective. There was much more money to be gained in oversold areas yesterday, so the DJUSPM paid the price. But as this bear market regains its grip on the weeks and months ahead, I’d expect the DJUSPM to be a significant outperformer.
Pre-Market Action (Wednesday December 26)
Volatility is the name of the game right now. Don’t believe me? Just look at the futures this morning. After a 650 point decline on the Dow Jones Monday, we saw a 1000+ point rally yesterday and this morning futures are lower by 340 points. The net effect? Nil.
The 10 year treasury yield ($TNX) is falling again, yet another reminder of the weaker economic environment that bond traders are expecting in 2019. As the TNX falls, it means money is rotating into treasuries, a negative for equities. That reality is reflected in stock futures this morning. Crude oil ($WTIC) rallied strongly yesterday, but is stumbling a bit this morning, down 1.50% at last check. Gold ($GOLD) is rallying $4 per ounce to $1277 after a small selloff on Wednesday.
The Tokyo Nikkei ($NIKK) rallied strongly overnight, gaining 3.88%. European markets are down sharply this morning.
Current Outlook
We’ve established a price support level to watch now. So the next major question is how high might we bounce? Let’s look at the past two bear markets to see the type of reaction highs seen after the “correction to bear market” price breakdowns. First, the 2007-2009 bear market:
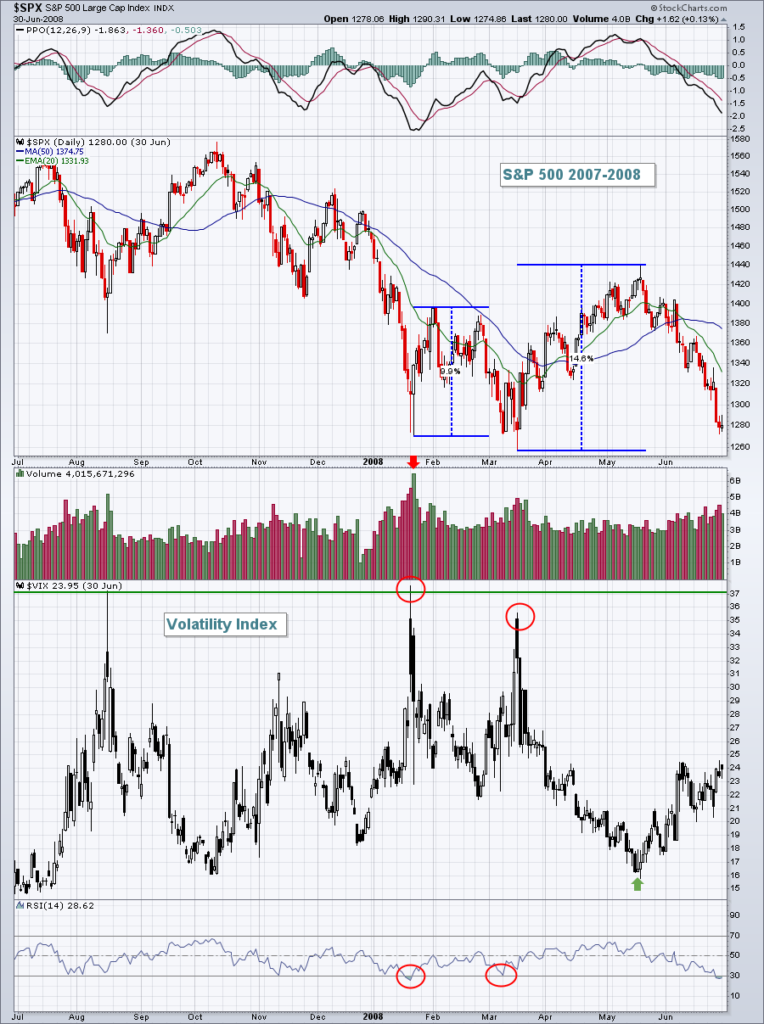
We saw the “correction to bear market” breakdown in January 2008. The bottom occurred when the VIX hit 37 and the reaction high two weeks later was roughly 10%. After moving down to retest the initial support level, we saw another huge rally, this one more than 14% and a temporary breakout above the prior reaction high. That second high was established when the VIX fell to 16. As I’ve noted on several previous occasions, the 16-17 support level on the VIX has not been violated during either of the prior two bear markets. The level of fear plays a HUGE role in trading bear markets. Excessive fear marks key bottoms and as fear evaporates and overhead resistance approaches, we look for reversals (and begin shorting, if that’s your style).
Let’s look at the 2000-2002 bear market:
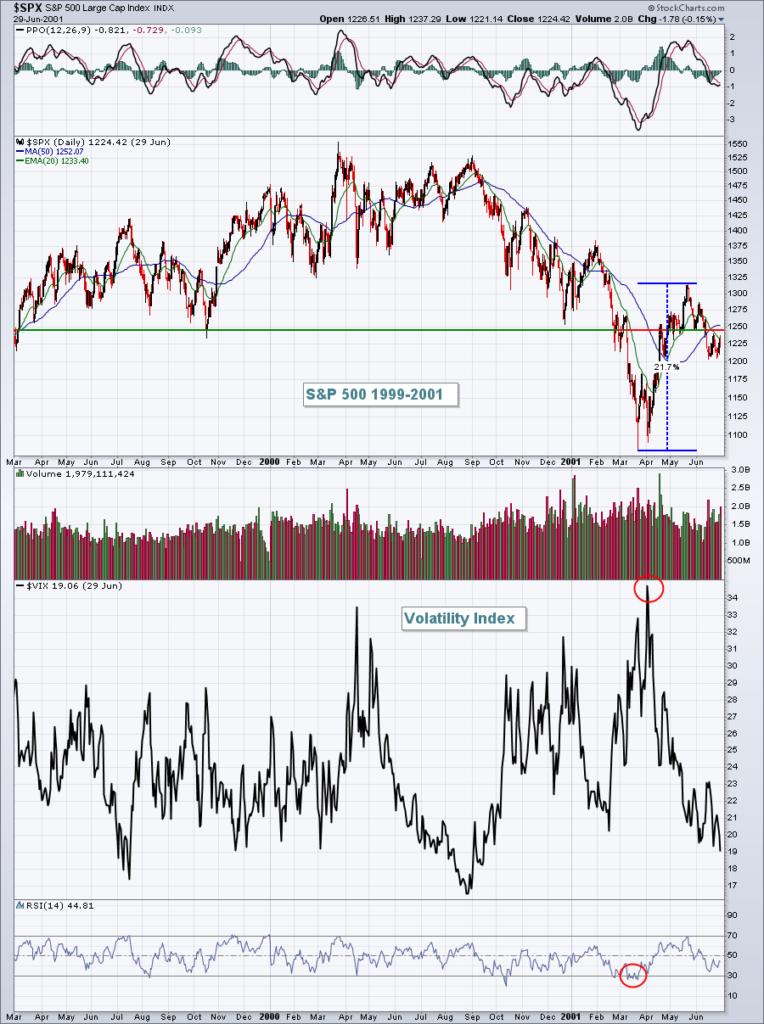
We see a similar pattern. The VIX moves into the mid-30s as a panicked, impulsive selling episode marks a key bottom. The S&P 500 initially bounces close to 10% and almost reaches the declining 20 day EMA before the selling kicks in again and we approach the prior low to establish a double bottom. The two month rally ends up providing a huge 21.7%, but look at the huge swings during that two month period.
Looking back using 20/20 hindsight makes it seem simple – just buy at the bottom and wait two months and pocket a 20%+ gain, right? Trust me, it wasn’t that easy back then and it won’t be that easy this time either. Those intraday and intraweek moves were BIG and the emotional toll if you happened to be on the wrong side was monstrous. I find it nearly impossible to trade an emotional market like the one we’re in now. For the past three weeks, there’s been selling, panic and despair. Then, out of nowhere, the Dow Jones rallies 1000 points and CNBC’s headlines are “Dow Jones Posts Its Biggest Gain EVER!!!” It’s true, but let’s keep things in perspective please. In my opinion, this rally – and it’s going to be difficult to determine how long it lasts – will be an opportunity to exit longs before the next leg lower in 2019. Perhaps we’ll be able to sustain the current rally, hold the price low established yesterday and trade higher in Q1. There’s a reasonable chance that we’ll do that, but it will come with crazy swings, swings designed to chase you out of your positions at just the wrong time.
There’s only one thing that will cure this volatile market. Time. My goal, as a trader, will be to preserve capital. While that’s always the goal, it’s even more imperative now with risks so elevated.
Yesterday’s (the day after Christmas) rally was obviously very nice and timely. But on this weekly chart, it’s nothing more than a blip on the radar. The green arrows highlight how important the 20 week EMA is to support a long-term bull market rally. The red arrows are now beginning to mark something much more ominous. These 20 week EMAs are the bears’ wild card in 2019 that they’ll play if forced to – and they’ll very likely work.
Historical Tendencies
It’s been a brutal December as we all know, despite the fact that December is the best calendar month of the year historically for both the S&P 500 and Russell 2000. On deck is January, which has been the best calendar month of the year for the NASDAQ. The NASDAQ has produced annualized returns of +31.72% during January since 1971.
Lastly, if you enjoy my analysis every day, please subscribe at the bottom of this article. Simply type in your email address in the space provided and click on the green “Subscribe” button. It’s 100% FREE and you won’t be spammed. You’ll then receive my blog article directly in the email address provided as soon as my article is published. I’ll do my best to bring you objective guidance throughout 2019 and beyond! Thanks so much!
About the author: Tom Bowley co-founded Invested Central and served as the Chief Market Strategist for more than 10 years. His unique trading style combines both his fundamental and technical strategies to systematically manage risk while trading. A regular contributor to StockCharts.com’s bi-weekly ChartWatchers newsletter since 2006, Tom’s role at StockCharts has expanded significantly since he joined the company as a full-time Senior Technical Analyst in March of 2015. Learn More
Ambrose Evans-Pritchard: BIS fears financial seizure at the heart of the world’s clearing system
Summary notes from Evans-Pritchard article dated December 16, 2018
- The pillars of the global financial system are fundamentally unstable and could lead to a frightening chain reaction in the next crisis, the world’s top watchdog has warned.
- Giant “central counterparties” (CCPs) that clear much of the $540 trillion (£428 trillion) nexus of derivatives are themselves vulnerable to failure in times of extreme stress.
- This is a worry looming ever larger as rising U.S. interest rates expose the weak links in global debt markets.
- The Bank for International Settlements (BIS) said in its quarterly report that the CCPs could cause “a destabilizing feedback loop, amplifying stress.”
- The implicit message is that well-meaning regulators may have made the financial architecture more dangerous by mistake.
- The near meltdown of the Scandinavian counterparty Nasdaq Clearing AB in September came as a rude shock to the global authorities, and a foretaste of what might happen on a much bigger scale should anything serious go wrong.
- The notional value of the derivatives cleared worldwide is 4.4 times world GDP, up from 2.8 times in 2008. JP Morgan alone has a $30 trillion book. (emphasis mine)
- The BIS warned that regulators have inadvertently created a “CCP-bank nexus” – somewhat akin to the sovereign/bank doom loop in the eurozone – in which the two feed on such other.
- The rotten apple contaminates the healthy banks. A fire sale of assets spreads contagion. Banks may be forced to hoard liquidity to protect themselves. The BIS said “balance sheet interlinkages” and what it calls the “CCP default waterfall” could unravel with “potentially system-wide effects”.
- It is just one of many late-cycle pathologies highlighted by the Swiss-based watchdog, the bank of the central banking fraternity and the high priest of orthodoxy.
- The BIS says the nature of the world’s business cycle has entirely changed over the last three decades. For most of the 20th Century booms turned to bust when rising inflation forced authorities to jam on the brakes. This is no longer the case. Globalization and the inclusion of China and emerging Asia in the trading system have suppressed inflation.
- What now brings the party to an end is excess credit and rising debt service ratios. As conditions tighten, the financial system eventually buckles under its own weight.
- The thrust of BIS research is that we may be close to this inflexion point. Standard & Poor’s says the number of junk bonds rated B minus or below has jumped from 17pc to 25pc over the last year. This is now the highest since the global financial crisis.
- The average yield on U.S. junk bonds has risen165 basis points to 7.2pc over the last year. A cascade of downgrades has begun. The spike has been even more dramatic in the eurozone where stress is nearing danger levels, leaving credit analysts baffled by the European Central Bank’s decision to halt QE this month.
- The BIS fears a waterfall effect. “The bulge of BBB corporate debt, just above junk status, hovers like a dark cloud over investors. Should this debt be downgraded, if and when the economy weakened, it is bound to put substantial pressure on a market that is already quite illiquid,” said Claudio Borio, BIS chief economist.
- The Achilles Heel for the global economy is the surging U.S. dollar. The BIS says offshore lending in dollars by European, Japanese, and increasingly Chinese and emerging market banks, has risen to $12.8 trillion. The figure is probably far higher if opaque “off-balance sheet” liabilities are included.
- This web of dollar liabilities is coming under intense strain as the U.S. Federal Reserve drains liquidity, pushing up global lending rates. A worldwide dollar shortage is emerging. This is acting as a tourniquet, tightening an international system built on dollar funding.
- The BIS warned that some of these offshore dollar lenders may face a “funding squeeze” of their own, forcing them to withdraw credit in a chain reaction. “Cross-border funding, regardless of the source, may be fickle in a crisis,” it said.
- The possibility that a major central counterparty might “fall over” in the next crisis is sobering. The G20 mandated a shift in global finance towards CCPs after the 2008 crisis, deeming them the “unlikely heroes” of the Lehman shock. The counterparties managed to auction, liquidate, or transfer almost all of Lehman’s derivative portfolios in an orderly fashion, including $9 trillion of interest rate swaps made up of 66,390 trades.
- But the G20 may have overinterpreted the Lehman lesson. There have been plenty of CCP failures in the past. France’s Caisse de Liquidation des Affaires came awry in 1974 when the sugar market blew up. The Hong Kong Futures Guarantee Corporation failed in 1987. The Chicago Mercantile Exchange had a close save the same year after the October crash.
That’s a lot to take in. Evans-Pritchard’s conclusion, “The G20 may have made the world financial system more hazardous.” Tell that to your buddy at the upcoming New Year’s Eve party. Well, maybe not… nobody loves a buzz kill.
What stands out for me is the $540 billion in derivative products. Some of that is used to hedge other bets but leverage is leverage and it hinges on one person’s ability to pay off another. In a $75 billion global economy, that amount of risk exposure is almost unimaginable. Thus, a more fragile structure and potential for systemic risk. TARP II may be playing in a movie theater near you. As in bail out the banks part II. The risk is real. Hope it never happens. Record high debt remains a concern. We just don’t know how it will play out. Stay risk minded with a downside game plan well established. Then just stick to your plan. The coming opportunities a Great Reset will create will be, as they say in the White House, “huuuuge.”
Trade Signals – Record Extreme Pessimism, Expect a Rally
December 26, 2018
S&P 500 Index — 2,351
Notable this week:
Daily Investor Sentiment is the lowest since 1995. It’s lower than anytime during the Great Financial Crisis. This is as extreme as it gets. Expect a rally.
However, the market is in a bear market by many measures. Posted in the “Dashboard” section and detailed in the “Charts with Explanations” section are a number of my favorite equity market indicators. I favor reducing equity exposure but doing so in a disciplined way. Diversifying to several different intermediate trend based processes. None are perfect but all are pretty good. For U.S. large cap exposure I favor, and use for the large cap exposure in our client moderate risk portfolio model, the NDR CMG Large Cap Long/Flat index. The model trend line currently sits at 63.68, just 3.68 points away from another risk reduction signal and clearly trending down. Should it hit a reading of 60, the process will reduce exposure from 80% to 40%. That could happen within the next few weeks. I mentioned last week that the 200-day MA 0.50% rules (for both the S&P 500 Index and the NASDAQ) had yet to signal sell signals… As of Tuesday’s close, the S&P 500 moved to a sell (see “Falling” trend in chart below). The NASDAQ 200-day rule remains in an uptrend buy signal (but very close to a sell signal). Markets tend to roll over at cyclical bull market peaks and they almost always “V” bottom at market bottoms due to the dynamics of how quickly leverage is unwound. Margin calls, forced selling and would be buyers step to the side. Once selling pressure flushes out, buyers return and markets spike from the lows. We may have reached one of those short-term bottoms. NDR CMG Long/Flat is designed to systematically reduce risk as the overall weight of trend evidence weakens and quickly get back to 100% exposure when trends turn back up. The 200-day MA rule or the 13-week over 34-week MA rule react more slowly off market bottoms. Thus my personal bias towards NDR CMG Long/Flat. If you are a professional investment advisor, I am happy to share our historical research that compares various approaches with you. Send me an email at blumenthal@cmgwealth.com.
Turning to the bond market: High yield remains is a sell signal. The Zweig Bond Model remains in a sell signal (suggesting short-duration high quality bond market exposure over long-duration funds and ETFs).
Hope this helps! Please email me if you have any questions.
As the great Art Cashin says, “Stay wary, alert and very, very nimble.”
Click here for this week’s Trade Signals.
Important note: Not a recommendation for you to buy or sell any security. For information purposes only. Please talk with your advisor about needs, goals, time horizon and risk tolerances.
Personal Note – The Best Christmas Ever (SNL)
I thought this short skit from Saturday Night Live was hilarious so I’m sharing it with you. Click on the photo to play. I hope you enjoy it as much as I did. It captures all the hard work and challenges a family with younger kids does to make the holiday magical. Hats off to you and everyone in your life who makes the magic happen. In our home, that’s Susan. Grateful for her!
Season’s Greetings, Merry Christmas and a very Happy New Year to you and those you love most.
Thank you for reading On My Radar. Please know how much I appreciate the time you spend with me each week.
♦ If you are not signed up to receive my weekly On My Radar e-newsletter, you can subscribe here. ♦
Stephen B. Blumenthal
Executive Chairman & CIO

