
“Davidson” submits:
Q4 2020 hedge fund letters, conferences and more
There is no doubt that there have been some wild trading days and massive over-valuation in some issues the past 12mos. Many seeing this activity have signaled this represents an economic cycle and stock market top. Even with fear of a market top widely believed, economic data with long histories of providing decent guidance do not support this level of pessimism. Those who only see hundreds of issues which have been overvalued fail to see the larger context and the thousands of issues which remain at significant discount to historical valuations. 4 charts describe current conditions in the larger context.
4 charts are used displaying different correlations with indicator repeats to make it easier to visualize how each of the indicators are predictive. The Chemical Activity Barometer(CAB) is used in 3 charts and for shorter and longer time spans. The CAB is the longest series with more than 100yrs of data. The SP500 is used in 2 charts to permit comparison with other economic indicators. The US$, Recession columns, Trucking Tonnage Index(TTI), Intermodal Rail(IR) and Temporary Help Services(THS) provide insight to the correlation between other important and reliable indicators. The best insight regarding the economic trend requires all these series(and a few more). The question one needs to answer is if most indicators are signaling the same trend taking into account that correlations are not perfect month-to-month but more prominent over 6mos.
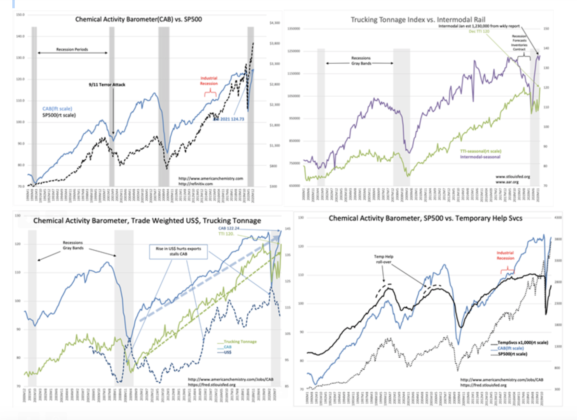
The COVID impact should be obvious. What should also be obvious is the full recovery in in CAB, IR, TTI and a decent recovery towards pre-COVID levels for THS. Economic activity is expanding and will continue to do so as the several million unemployed return to work. The official end of the current recession has not been determined by NBER but CAB has turned higher at recession end points. By this measure, the US exited recession April-May 2020. Yet, many believe severe recession continues and extreme stimulus is required. The economic data does not support this thinking. Review these charts and draw your own conclusions.
While the US continues to have highly visible pockets of distress, namely entertainment venues, bars, restaurants, air and cruise travel, a good portion has recovered and some are doing better than pre-COVID even with most of the countries outside the US reporting distress. Recovery is well down the road, there is more to come. Still, investors are lopsided towards technology themes which did well under the COVID lockdown ignoring for the most part the thousands of companies representing core US economic activity.
By all measures, the US exited recession April-May 2020. Economic trends are expansive and under-recognized. The many calls for a market top in my opinion have missed and continue to miss the strength of recovery. Well-regarded economic indicators signal much higher equity prices are likely for non-FAANG-type issues.

