
When it comes to understanding the size and scope of the $18 trillion U.S. economy, it’s sometimes easier to consider that it’s the sum of many parts.
Q2 hedge fund letters, conference, scoops etc
Many states already have economies that are comparable to some of the world’s largest countries, giving you a sense of what they might be combined.
And while every state plays a role in the bigger picture, some states such as New York and California have an outsized impact on fueling the country’s overall economic engine.
The State of State Economies
Today’s animation comes to us from SavingSpot, and it covers the size of state economies by GDP going back all the way to 1963.
The video uses inflation-adjusted data from the U.S. Bureau of Economic Analysis, showing how the ranking of top state economies has changed over time as different states have taken advantage of economic booms.
Let’s dive into the data to see how things have changed.
Going Back in Time
The earliest data in the animation comes from 1963, when New York led the pack with a $70.6 billion economy in inflation-adjusted terms.
State Economies by GDP, Inflation-Adjusted Chained $USD (1963)
| Rank | State Economy | GDP, Billions of USD (1963) | Share of U.S. Economy |
| United States (Total) | $607.0 | 100.0% | |
| #1 | New York | $70.6 | 11.6% |
| #2 | California | $67.8 | 11.2% |
| #3 | Illinois | $39.5 | 6.5% |
| #4 | Pennsylvania | $34.5 | 5.7% |
| #5 | Ohio | $33.3 | 5.5% |
| #6 | Michigan | $30.5 | 5.0% |
| #7 | Texas | $29.3 | 4.8% |
| #8 | New Jersey | $23.4 | 3.9% |
| #9 | Massachusetts | $17.4 | 2.9% |
| #10 | Indiana | $15.6 | 2.6% |
PreviousNext
California ($67.8 billion), Illinois ($39.5 billion), Pennsylvania ($34.5 billion) and Ohio ($33.3 billion) round out the top five, and together they added up to 40.5% of the national GDP.
The Largest State Economies by GDP Today
Looking at the most recent data from 2017, you can see the ranking changes significantly:
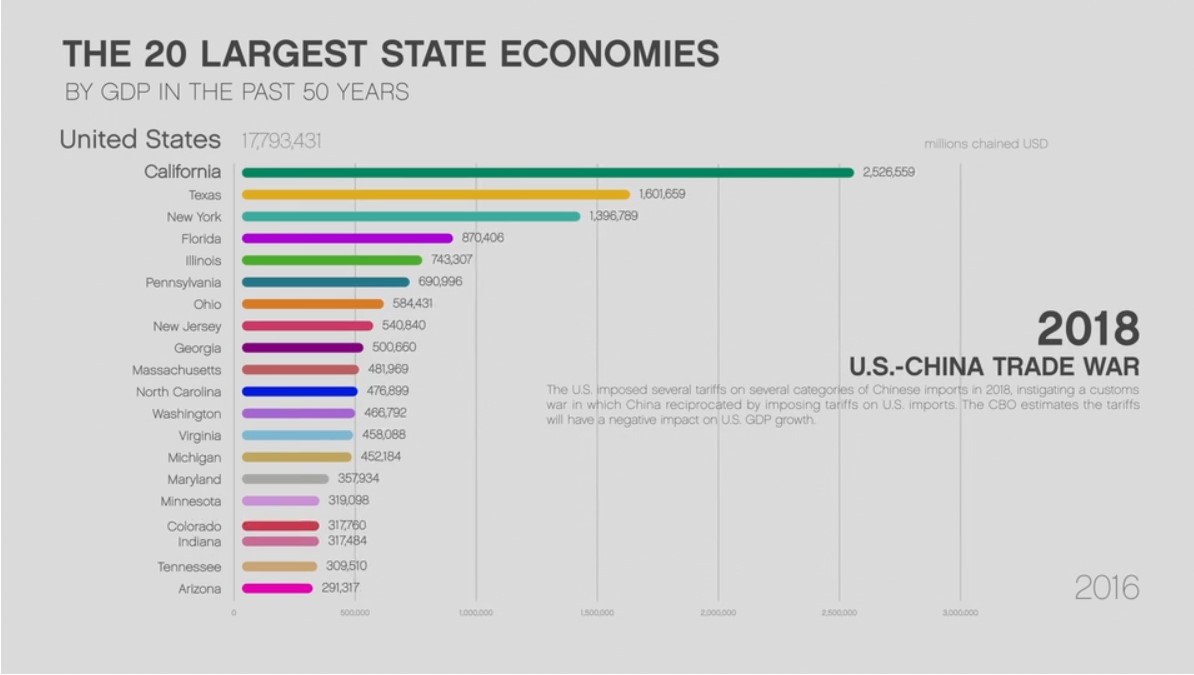
State Economies by GDP, Inflation-Adjusted Chained $USD (2017)
| Rank | State Economy | GDP, Billions of USD (2017) | Share of U.S. Economy |
| United States (Total) | $18,051 | 100% | |
| #1 | California | $2,576 | 14.3% |
| #2 | Texas | $1,616 | 9.0% |
| #3 | New York | $1,414 | 7.8% |
| #4 | Florida | $883 | 4.9% |
| #5 | Illinois | $745 | 4.1% |
| #6 | Pennsylvania | $701 | 3.9% |
| #7 | Ohio | $591 | 3.3% |
| #8 | New Jersey | $547 | 3.0% |
| #9 | Georgia | $511 | 2.8% |
| #10 | Michigan | $459 | 2.5% |
California is the largest economy today – it has a state GDP of $2.6 trillion, which is comparable to the United Kingdom.
Meanwhile, Florida and Georgia are two states that did not crack the top 10 back in the 1960s, while Texas jumped up to become the second largest state economy. It’s actually not a coincidence that all of these states are in the southern half of the country, as air conditioning has played a surprisingly pivotal role in shaping modern America.
In fact, the share of the nation’s population living in the Sunbelt rose from 28% in 1950 to 40% in 2000, and this increase in population has coincided with economic growth in many of the states that used to be a sweaty mess.
A Final Look
Here is a final animated version of the top 10 largest states by GDP, also provided by SavingSpot:
Article by Visual Capitalist

