
Yesterday Apple announced new iPhone models that will be bigger, will be better, faster, stronger, and—of course—more expensive. Over the summer Apple (AAPL) passed the $1 trillion in market cap value milestone. Amazon (AMZN) followed not too long after. Today one share of Apple cost $224, up 32% just in 2018.
[timeless]
Q2 hedge fund letters, conference, scoops etc
If there’s one stock that analysts couldn’t get right, it’s Apple. Not because they are not smart. It’s the opposite, most analysts are very brilliant. The problem is that analysts are stuck playing the short-term quarter to quarter game of guessing how many iPhones Apple will sell. Apple has over 100 analysts following the company. At this moment last year, when the iPhone X was announced, analysts were saying the cost of the iPhone was too high and sales would slow down, and the stock would fall. Following Q2-2018 results, analysts changed their tune when Apple blew the estimates out of the water. Analysts are now saying that because the iPhone X was selling so well it would eat into future revenues. Analysts insights are interesting, but if you are a retail investor, I suggest to do your own homework and invest with a long-term horizon. And ignore the short-term noise.
How did we get to $1 trillion? The Ringer made this interesting 7 min long video.
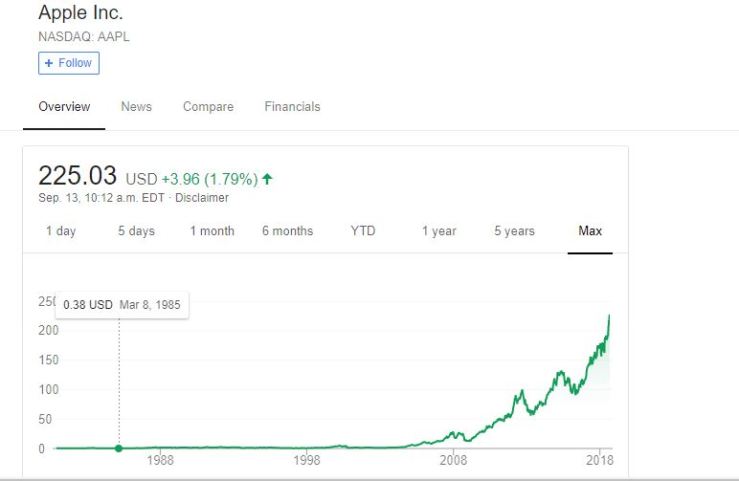
A year and a half ago I wrote this article on Seeking Alpha. Apple was trading at $106 a share. Apple was a 205-bagger from 1990 to March 2016, without calculating dividends. But it wasn’t an easy ride. You needed an 80% loss twice in order to get it and the large majority of the gains came after the iPhone was released in 2007. This is not your classic buy and hold fairy tale. Below are a couple tables and charts that display Apple’s rocky ride to $1 trillion.
The first table summarized Apple’s stock price since the IPO in the early 80s. It wasn’t necessary a good time to buy and Apple was on survival mode for over the next decade. The stock hover around $0.50 to $2 for the large part of its existence.
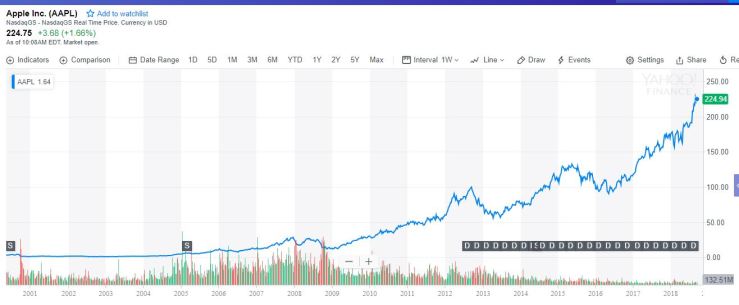
This second chart shows that the multi-bagger gains came after 2007, when the iPhone was released.
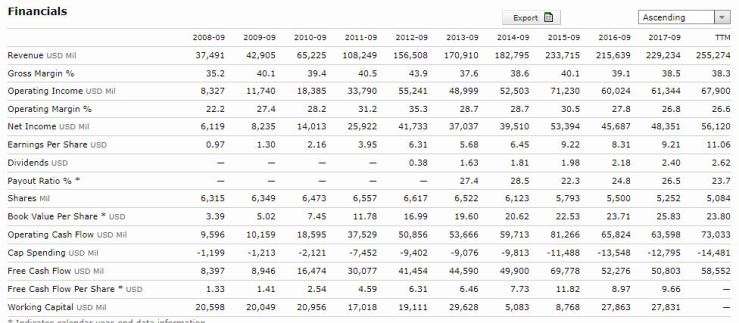
Below is a 10-year chart of Apple financials. Look at the revenue growth, going from $37 billion to $229 billion at the end of fiscal 2017. And it is still growing….
Article by Brian Langis

