
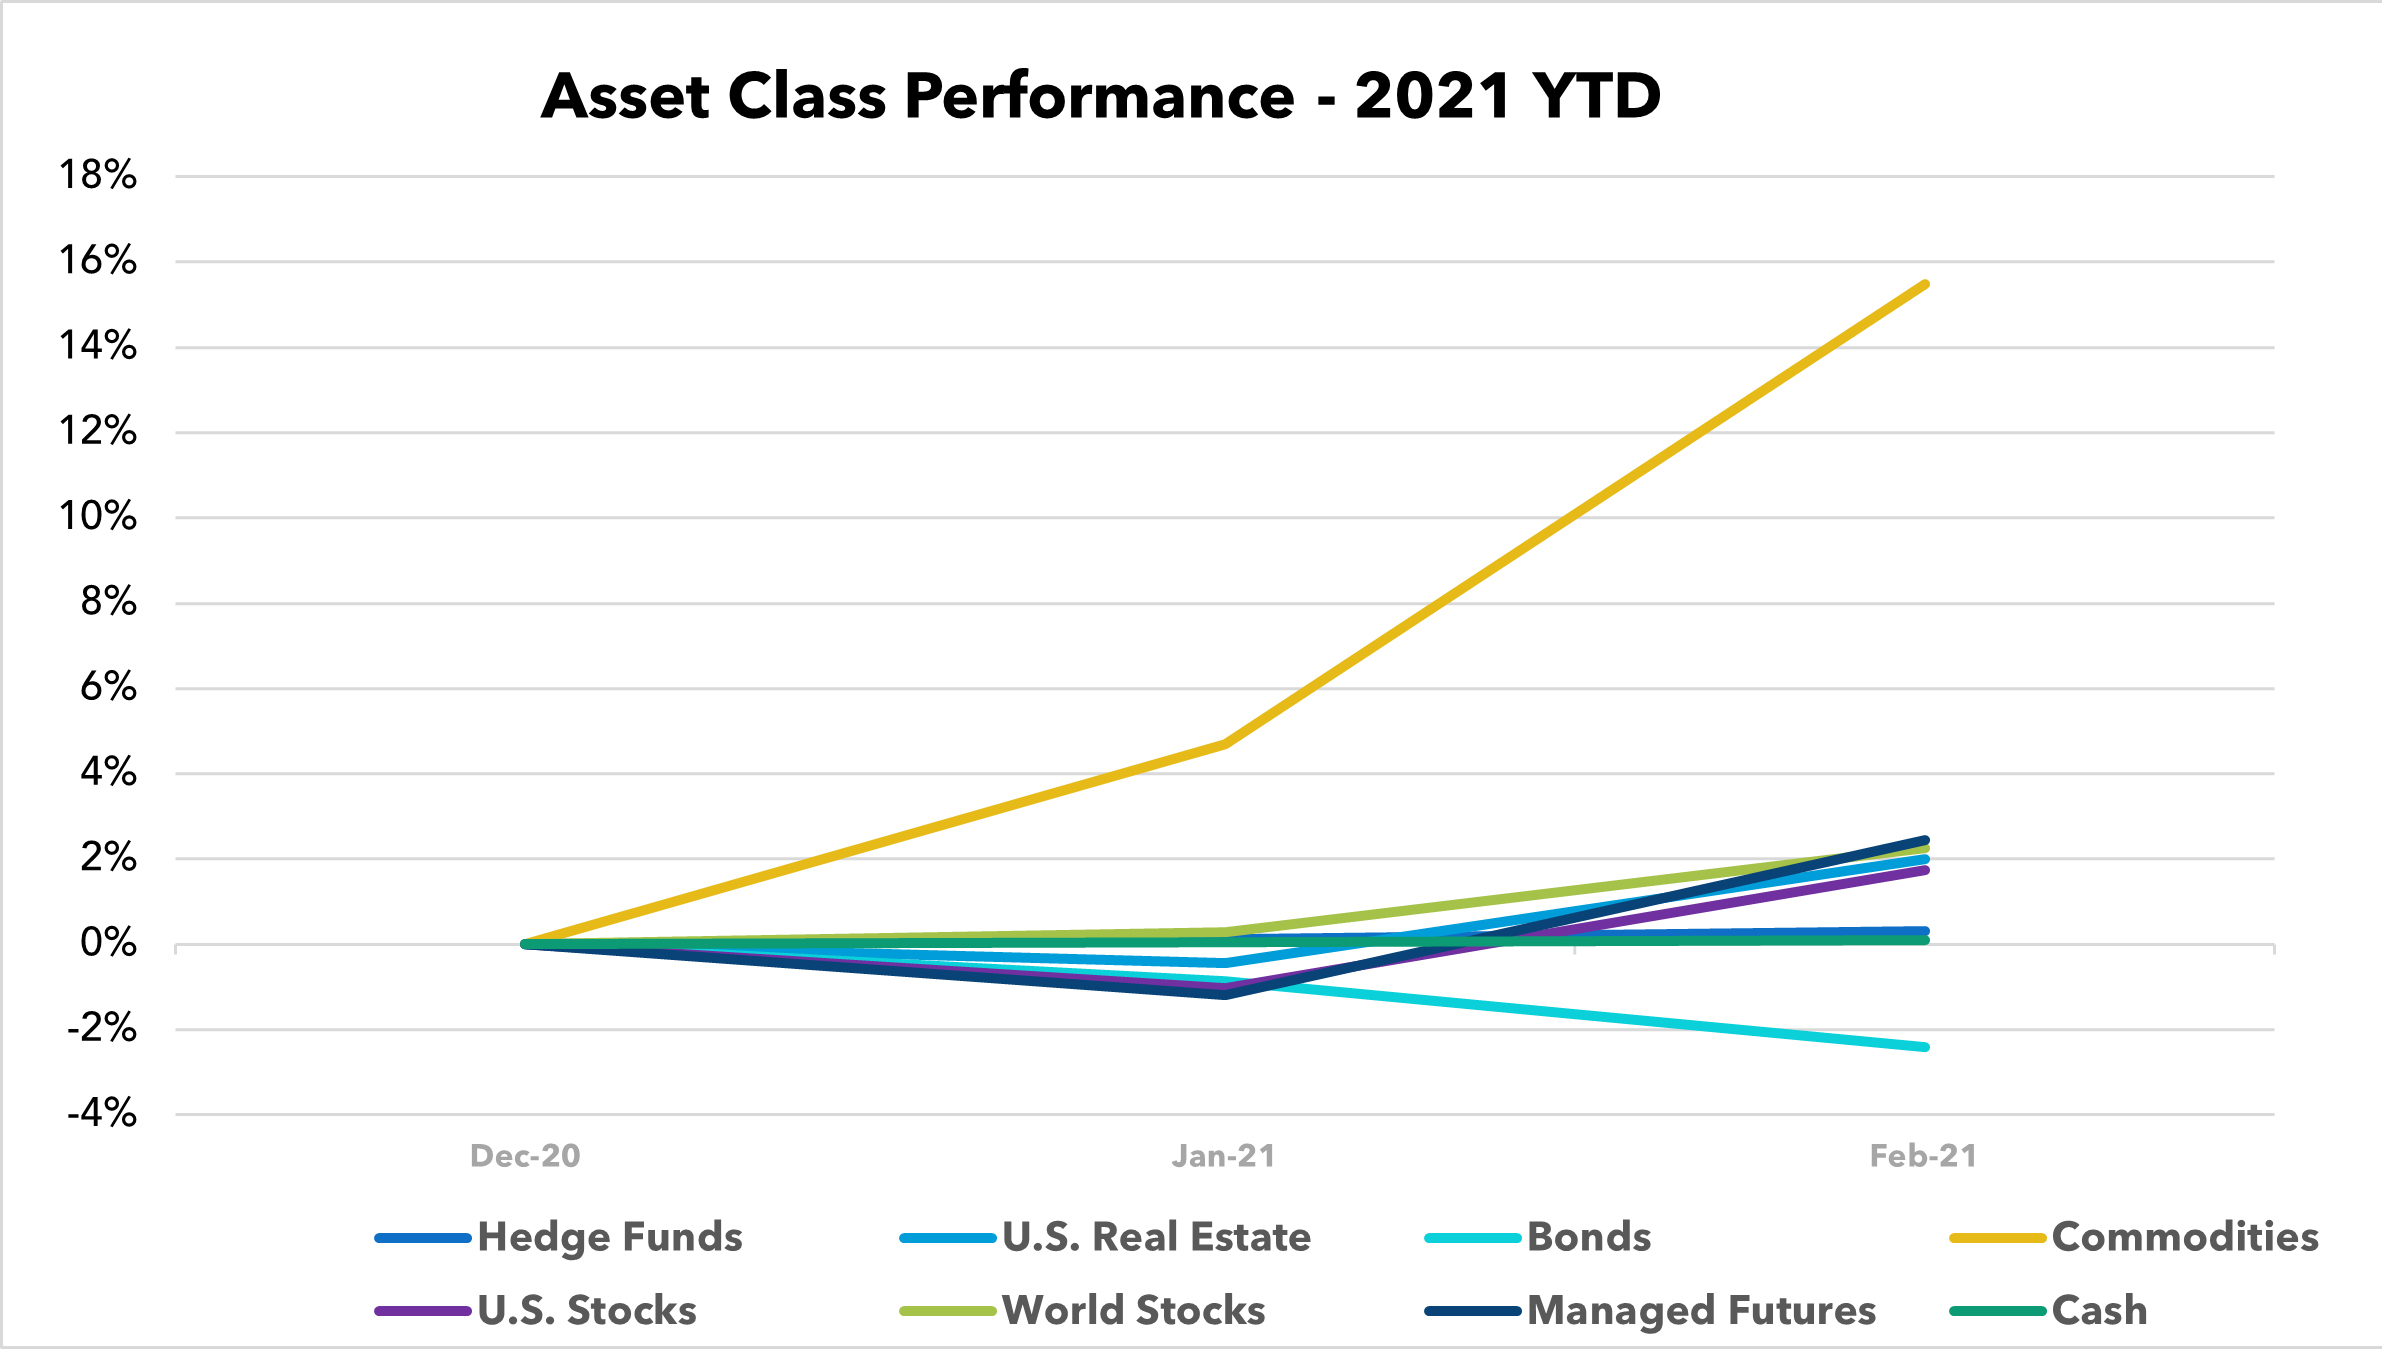
Last year it feels like all we talked about was the rough performance of commodities and now we’re reading headline after headline of a 2021 commodity supercycle “driven by stimulus spending and a weaker US dollar” (SP Global). Up 15% for the year already, I think we’ll be talking about commodity performance for a good portion of 2021.
Q4 2020 hedge fund letters, conferences and more
As for the rest of the chart, Managed Futures are holding down second place with a good start to the year in a great turnaround from the first month of 2021, and bonds will most likely be facing a stormy few months with low performance, low volatility, and low rates.

Past performance is not indicative of future results
Past performance is not indicative of future results.
Sources: Managed Futures = SocGen CTA Index,
Cash = US T-Bill 13 week coupon equivalent annual rate/12, with YTD the sum of each month’s value,
Bonds = Vanguard Total Bond Market ETF (NYSEARCA:BND),
Hedge Funds = IQ Hedge Multi-Strategy Tracker ETF (NYSEARCA:QAI)
Commodities = iShares S&P GSCI Commodity-Indexed Trust ETF (NYSEARCA:GSG);
Real Estate = iShares U.S. Real Estate ETF (NYSEARCA:IYR);
World Stocks = iShares MSCI ACWI ex-U.S. ETF (NASDAQ:ACWX);
US Stocks = SPDR S&P 500 ETF (NYSEARCA:SPY)
All ETF performance data from Y Charts
Article by RCM Alternatives

