
Wow! That was a bounce. In the words of Mr. Castanza “I’m back…baby!“. Or if you want something a bit more modern….”Chewie…we’re home!”. Either way, investors rushed to remember what a positive month looks like after basically every asset class was down in 2018, with stocks flirting with a rare double digit gain while real estate managed the feat. Managed futures, meanwhile; found themselves on the wrong side of the trend reversal, fighting to limit losses on the month. One thing we’re sure of, this chart won’t look the same come the end of 2019 as it does now at the beginning.
Q4 hedge fund letters, conference, scoops etc
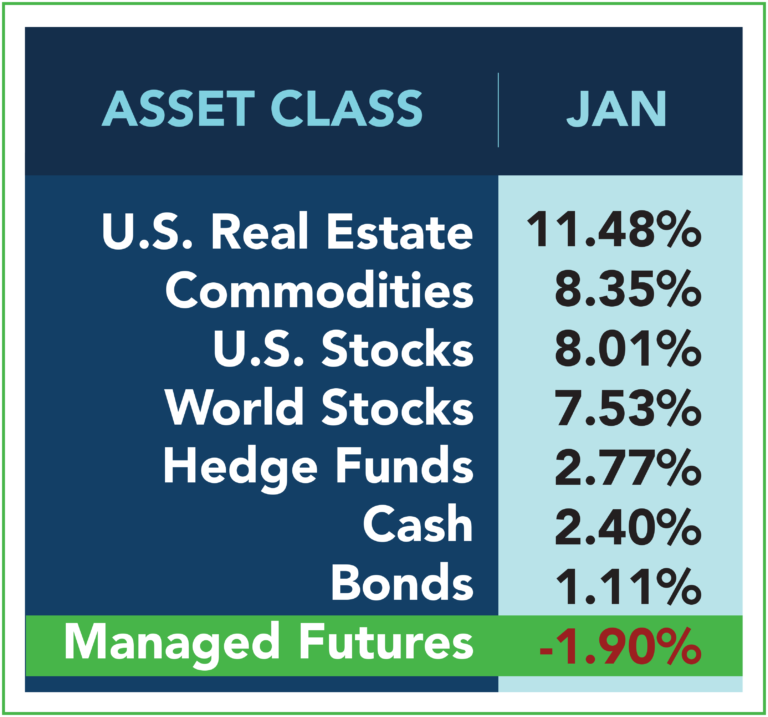
Past performance is not necessarily indicative of future results.
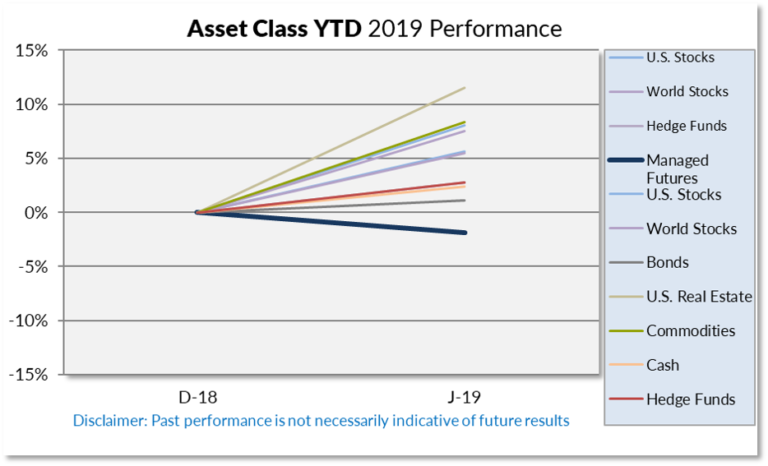
Sources: Managed Futures = SocGen CTA Index,
Cash = US T-Bill 13 week coupon equivalent annual rate, with YTD the average of each month’s value,
Bonds = Vanguard Total Bond Market ETF (NYSEARCA:BND),
Hedge Funds = IQ Hedge Multi-Strategy Tracker ETF (NYSEARCA:QAI)
Commodities = iShares S&P GSCI Commodity-Indexed Trust ETF (NYSEARCA:GSG);
Real Estate = iShares U.S. Real Estate ETF (NYSEARCA:IYR);
World Stocks = iShares MSCI ACWI ex-U.S. ETF (NASDAQ:ACWX);
US Stocks = SPDR S&P 500 ETF (NYSEARCA:SPY)
All ETF performance data from Morningstar.com
Article by RCM Alternatives

