
Those that follow my personal account on Twitter will be familiar with my weekly S&P 500 #ChartStorm in which I pick out 10 charts on the S&P 500 to tweet.
Typically I’ll pick a couple of themes and hammer them home with the charts, but sometimes it’s just a selection of charts that will add to your perspective and help inform your own view – whether its bearish, bullish, or something else!
The purpose of this note is to add some extra context beyond the 140 characters of Twitter. It’s worth noting that the aim of the #ChartStorm isn’t necessarily to arrive at a certain view but to highlight charts and themes worth paying attention to.
So here’s the another S&P 500 #ChartStorm write-up!
1. VIX Futures Curve Indicator: First up is a look at the VXV vs VIX (i.e. 3-month VIX futures price vs the spot VIX). The reason this is a useful and interesting indicator is that when it undertakes extreme movements to the downside i.e. the VIX spikes beyond the futures price, it can present a kind of oversold or buying signal. This is because it basically implies that options traders are bidding up implied volatility i.e. they are more fearful vs futures traders. Of course with the benefit of hindsight, fear is sometimes rational and sometimes irrational.
Bottom line: The VXV vs VIX indicator remains in fear/oversold mode.

2. VIX Futures Curve Signal: The next one, from Tom McClellan, shows instances where spot VIX was trading above all VIX futures contracts, overlayed on the S&P500. So very much similar to the previous chart but setting the conditions against the entire VIX futures curve. It’s interesting to note how each of these instances coincided with a short term market bottom. Albeit, the 2015/16 corrections show that the bottom in larger corrections can take some time to be found, even after the signal is triggered.
Bottom line: The VIX vs futures curve signal has lit up for the S&P500.
3. More on Volatility: Following on the topic of volatility, this chart presents an alternative view of realized volatility – taking the rolling annual count of days where the S&P500 moved by greater than 1% (up or down). After reaching a 50-year low early this year, this indicator has decisively turned up. But it’s important to note how rising volatility – while often occurring during the start of a bear market – can sometimes be correlated with rising stocks. This is what I’ve referred to before as a more erratic bull market. Either way, it looks like we are entering a regime of generally higher volatility, particularly as the global central banks ease off on stimulus.
Bottom line: Realized volatility has reached a turning point.
4. Cross-Asset Implied Volatility: Back on the topic of implied volatility, this chart shows in the black the CBOE VIX, and in the red an average of implied volatility for the bond market, currencies, and commodities – basically a Cross Asset Implied Volatility Indicator. Two things standout on this one, first it reached an extreme low earlier this year, and like equity volatility has turned up since. Again I believe this will be another boat that will be tossed around by the turning tides of global monetary policy.
Bottom line: Cross asset implied volatility is starting to rise along with the VIX.
5. The Common Sense Indicator: Final one on the VIX – this interesting indicator has been termed “The Common Sense Indicator” by Kai Pflughaupt of Macro Technicals. It is simply the ratio of the S&P500 to the VIX, and importantly, is displayed against its long term trend, with standard deviations from trend indicated. This type of indicator will naturally trend over time because it is comparing a stationary and non-stationary series, but adding the deviation from trend aspect gets around this issue. The main point of interest is how it moved from an extreme sell signal to now a more neutral if not mild buy signal.
Bottom line: The Common Sense Indicator has moved back to neutral from extreme sell levels.
6. Forward PE vs Trend Channel: Another interesting use of trendlines is featured in this chart from Stock Board Asset, with the original chart from FactSet. It shows the forward PE ratio undertaking a significant correction down to the lower end of the trend channel – the implication being that it may rebound and go higher. In absolute levels it has more than unwound the increase from tax-cut-hype, albeit the impact of tax cuts have shown up in stronger forward earnings so the fall in the forward PE ratio has been more accentuated. Anyway you can’t say it’s cheap vs history at these levels, but it is certainly less expensive than it was.
Bottom line: The forward PE ratio has come down to the bottom end of its trend channel.
7. Earnings Growth: We’ve heard a lot about the surge in forward earnings thanks to the tax reforms, but it’s important to note how strong trailing earnings growth has been, with the Q4 results up 22.6% YoY – a 7-year high. It’s important to be very mindful of earnings trend when a market correction is underway. Market corrections are far more dangerous when earnings are declining or decelerating vs when earnings are on an improving path. You have to of course be forward looking, but even then the global and domestic economic backdrop look sound.
Bottom line: The pace of earnings growth is running at a 7-year high.
8. Buybacks are Back: This chart, shared by Lance Roberts, shows the annualized announced buybacks on the cards in 2018. While it is just an annualized figure, buybacks have been a key force in driving the market higher. So it’s again important to be mindful of such trends. You might not agree that they are the best use of corporate funds (vs say capex or M&A or R&D), but it’s still going to have an impact.
Bottom line: Indications are that 2018 could be a record year for corporate stock buybacks.
9. The Big Short in Junk Bonds: This chart shows short interest (specifically, shares sold short as a proportion of total outstanding shares) in the major junk bond ETFs. Typically this can be considered smart money, so it’s worth paying attention to. To my mind there’s a few reasons why you would, or at least would have been, short junk bonds: a. the duration aspect i.e. junk bonds are vulnerable to a generalized rise in bond yields; b. spreads were overvalued and vulnerable to a selloff; and c. a few of my lead indicators are suggesting caution on high yield credit. Given there tends to be linkages between junk bonds and the stockmarket (both the funding aspect, and risk sentiment aspect) this is one area of the markets worth keeping on top of.
Bottom line: There has been a big increase in short positioning on junk bond ETFs.
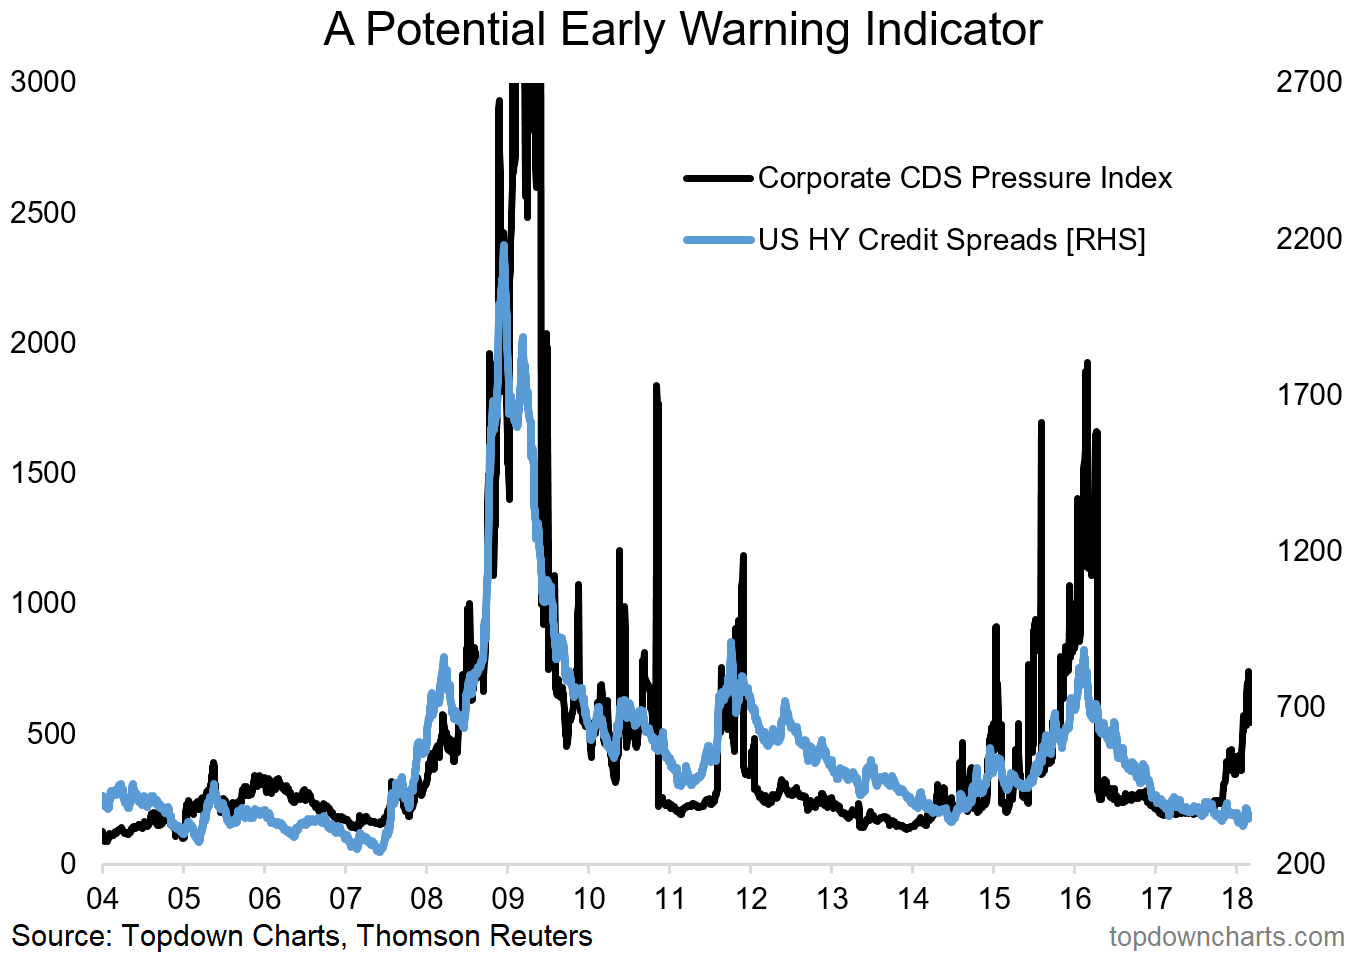
10. Corporate CDS Pressure Index: One of my own here (one of the indicators I mentioned in the previous segment), this indicator looks across 17 different Corporate CDS Sector indexes from Thomson Reuters Datastream and gives extra weight to sectors that are on the move e.g. if a certain sector or group of sectors are seeing spreads widening it will show up in this indicator. In this sense it can serve as a potential early warning indicator. Indeed, in this context, the slight blip up in US HY credit spreads that we saw in February looks decidedly underwhelming. That said, across all the indicators I watch for credit, there are a couple of positive/supportive ones, so it may well be idiosyncratic risks that we are seeing here, rather than systemic risks.
Bottom line: The Corporate CDS Pressure Index is on the rise, which is a potential early warning sign.
So where does all this leave us?
This week there were probably 3 main themes
1. Rising Volatility
Whether it’s the VIX itself, cross asset implied volatility, or various measures of realized volatility, one thing seems clear – that volatility is on the rise, and the global macro themes seem to support this trend.
2. Buy Signals
On buy signals or bullish points, there was the neutralization of the ‘common sense indicator’, the VIX futures curve indicator, the cheapening of forward PE ratios, and all of this against the backdrop of improving earnings and the prospects of more buybacks.
3. Junk Bonds
With regards to junk bonds, there was big shorts showing extreme pessimism on the asset class, and a pickup in a potential early warning indicator.
Summary
Tying it all together, indicators like the VIX show that there remains a sense of fear in the market, even if this does not perhaps feel broadly evident. Add to this the emergence of several buy signals of varying strength, and what seems to be still a solid fundamentals backdrop with decent earnings growth and the prospects of more buybacks, the weight of evidence seems to favor the case of bulls. But with the turning tides in global monetary policy, and rising volatility, it’s not all plain sailing, and the developments in high yield credit warrant close monitoring. So overall I would say it looks like a case of cautious optimism.
See also: Weekly S&P500 #ChartStorm – 4 Mar 2018

