
“The markets believed in December that the Fed was on the precipice of making a huge policy error – and the central bank pulled back. End of story…
From my lens, the Fed had already overtightened and recession risks for this year are elevated and on the rise.
Only history will be the arbiter of whether the downturn already got priced in during the setback in last year’s fourth quarter – I wouldn’t necessarily rule out a retest of those lows.
But what is important is that the Fed is not going to allow any further steep correction beyond that, if it can, and Powell has already shown his hand in terms of where his “put” is… and it is at the December lows.”
– David Rosenberg, Chief Economist & Strategist, Gluskin Sheff + Associates Inc.
Q4 hedge fund letters, conference, scoops etc

The Fed minutes came out Wednesday and they generated, as they tend to do, a lot of buzz. David Rosenberg, Chief Economist and Strategist of Gluskin Sheff, suggests the Fed Put is back in play and he may be right. The line in the sand now sits at the Christmas Eve low. That seems logical over the near term anyway. I wrote last week the market is 19 for 19, so expect “A Probable Retest of the December Low” but a retest remains in question.
I recall an interview Stan Druckenmiller did with Bloomberg Television in December 2018. Stan was talking about the stock market correction. In mid-December it seemed clear Fed Chairman Jerome Powell had channeled former Fed Chairman Paul Volker’s inner strength. The Fed had been raising interest rates since December 2015, with expectations for two to three more hikes in 2019. Quickly, Powell U-turned and so did the ECB and China. The liquidity spigot is back on.
The market is stuck between late cycle/richly priced and Fed QE. With the markets correcting in December, I remember thinking Powell may have Volker’s thick skin. Do you remember then-Fed Chairman Paul Volker’s resolve to raise interest rates to the mid-teens to fight inflation? I think I still have a “whip inflation now” button sitting in a dusty basement box. Well, forget the Volker comparison… Powell blinked. Rosenberg is right, “Powell has shown his hand in terms of where his ‘put’ is… and it is at the December lows.”
“@sentimentrader: In 119 years of history, the Dow Industrials have swung from a 52-week low to an 8-week win streak of > 15% two times. Those were November 29, 2002. And today.” [Friday, Feb. 15, 2019]
People often say that the economy is good and that justifies buying stocks, yet it is really the opposite that is true. The best buys come after recessions. That’s when valuations get good again. Defaults rise, fear kicks in, margin leverage unwinds and prices reset. With 30% of the Russell 2000 companies living on borrowed funds, you can imagine the challenges making payroll when access to financing dries up. This is why protecting wealth ahead of recession is so important.
Druckenmiller, perhaps the greatest investor of our day (maybe of all time), commented in December, “The inside of the stock market, which is the best economist I know and which I’ve used every cycle when I’ve invested, is saying there’s something not right there.”
And maybe this too is on Powell’s mind. More from Druckenmiller,
- Since 2010, corporate nonfinancial debt has increased to $6 trillion from $9.6 trillion and during that time corporate earnings have risen 27%. And the only way to explain a 60% rise in the S&P 500 during this time is “because all that borrowed money went to finance buybacks and M&A,” the Fed pushing investors to take on more risk and POTUS to do more fiscal spending.
- The U.S. could be looking at a 2007-type situation, though he’s not forecasting a recession like some, or even advocating for a rate cut. He also told Bloomberg that he owns Treasurys, he’s short financial stocks and thinks cloud-computing stocks like Microsoft and Salesforce will outperform even if the economy contracts.
- But over the next three to five years, returns will be no picnic.
One tool to forecast recession looks at the stock market. It is one of my four favorite U.S. recession indicators and it just flashed an economic “Contraction” signal at the end of January.
Here is how to read the chart:
- When the S&P 500 drops below its five-month smoothed moving average trend line 4.8%, a contraction signal is generated.
- Note the down arrows prior to or just after the grey shaded recession bars.
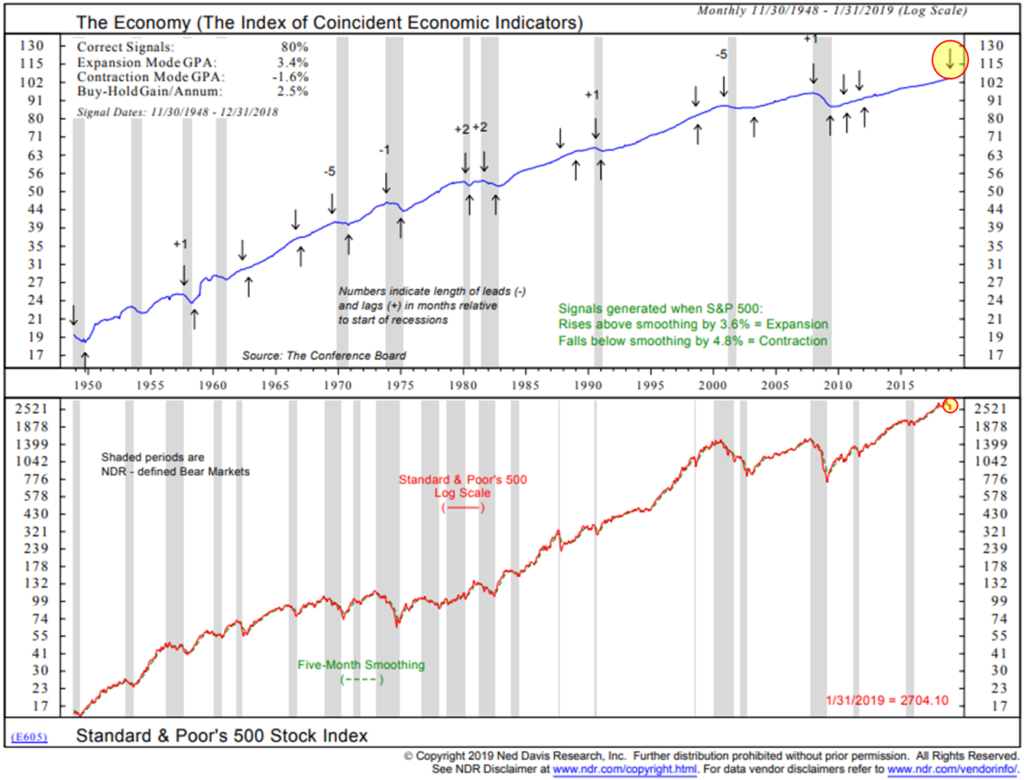
Lights on. Of the remaining three U.S. recession watch indicators (employment trends, credit conditions – a measure of ability to borrow and the inverted yield curve), only the yield curve is anywhere near flashing a recession signal and even when it does, it provides a very early warning with about a year from signal to recession start. Of course, no guarantees in this business. Overall, I continue to see no sign of recession inside the next six months.
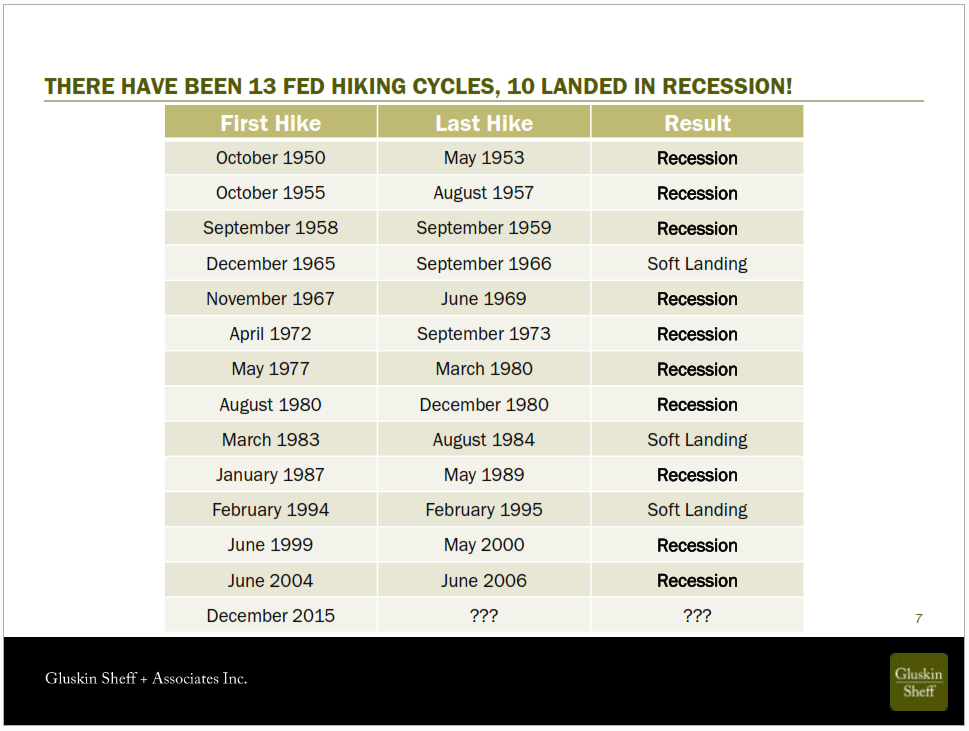
Our starting conditions matter. Perhaps “buy the dip” is back in play. But caution and risk management remain wise. Stocks remain richly priced and the economic expansion cycle is aged. It will be 117 months old in a week. The record is 120 months. The average since 1950 is 40. There have been 13 Fed hiking cycles since 1950. Ten of them resulted in a U.S. recession.
One last quote from Druckenmiller that resonates with me and maybe you as well, “The way to build long-term returns is through preservation of capital and home runs.” Protect your core and find a small handful of exceptional return drivers. Size your portfolio appropriately to your time horizon and risk tolerance. As advisors, I believe our mandate is to make money on an absolute return basis, to protect our clients from material declines, enabling the power of compound interest to grow core wealth over time.
Grab a coffee and find your favorite chair. With permission, I share with you a portion of David Rosenberg’s current thinking. He has allowed me to offer you a free trial to his daily missives. If you are interested please contact Marcel Aulls at maulls@gluskinsheff.com and mention my name. Below you’ll also find a well-done and thoughtful piece from Camp Kotok fishing friend, Robert Eisenbeis, Ph.D., on the growing drumbeat towards taxing wealth in addition to taking income. Dr. Eisenbeis suggests tax wealth may be a move down a dangerous path noting, “We need to remember that our Declaration of Independence promotes the ‘pursuit of happiness,’ which has come to mean equal opportunity, not equal incomes or equal wealth.” Robert was Director of Research for the Federal Reserve Bank of Atlanta where he advised the bank’s president on monetary policy for FOMC deliberations and was in charge of basic research and policy analysis. He currently serves as Cumberland Advisors’ Vice Chairman and Chief Monetary Economist. A sharp mind! Deeply connected. Worth the read.
♦ If you are not signed up to receive my weekly On My Radar e-newsletter, you can subscribe here. ♦
Follow me on Twitter @SBlumenthalCMG
Included in this week’s On My Radar:
- More on the Fed Minutes, from Rosey
- Taxing Wealth Instead of Income? by Robert Eisenbeis, Ph.D.
- Trade Signals – No Significant Changes; Equity Signals Remain Poised to Change
- Personal Note – Powder Snow
More on the Fed Minutes, from Rosey
From “Breakfast with Dave,” dated February 21, 2019:
The global MSCI (index) has managed to post an impressive 15% rally over those late-December lows, which now seems like eons ago. In less than two months, more than $7 trillion of global market cap has been restored to public equities and all it took were some soothing remarks from the Fed that “it has your back as an investor,” with most other central banks following suit. Indeed, have a look at An ECB Boost for Banks Gains Credence on page B10 of the Wall Street Journal. There was nothing in yesterday’s [Wednesday, Feb. 20, 2019] FOMC minutes that convinced me that the next move is a rate hike – quite the opposite, in fact – and it now looks like the QT phase is going to come to an early end and leave the Fed’s balance sheet larger in size than previously envisaged. Some pundits are taking one sentence from the minutes to the effect that several FOMC members would be willing to raise rates at some point so long as the myriad of downside risks listed in the document don’t come to fruition. Okay – knock yourself out with that. I would readily agree that there is a 1-in-20 chance of that occurring. In fact, it is interesting to see that even though the Treasury market was little changed yesterday, the Fed Funds futures contract went ahead and priced in 12% odds of a rate cut by year-end, up a bit from before the release of the FOMC minutes and far higher than the 3% probability being attached to this prospect a month ago.
Now, page B12 of the WSJ tries to make the case that “Much of the recent weakness appears transitory” and cites the government shutdown, the winter weather and the tightening in financial conditions late last year. But the Fed, in yesterday’s minutes, made it very clear that the soft patch is likely not at all temporary. [Emphasis mine.]
Beyond trade issues, the slowing in China and near-recession conditions in Europe, not to mention the Brexit uncertainties, the minutes made it very clear that the central bank does expect a domino effect on growth to take hold from the prior rate hikes put into the system. Also, don’t forget about the effects on the economy from a fiscal stimulus fading into the background. And nowhere to be found in the WSJ piece was any reference to the multiple times the minutes mentioned how inflation risks have ben tilted to the downside (isn’t that one of its two principal mandates?).
There is both good news and bad news for the S&P 500. The good news is the break of the 200-day moving average, and the broad participation with more than 90% of the members above their 50-day trend lines, which is a number we last say coming off the early 2016 lows. The cumulative A-D line has hit a new record high even though the index itself is still a bit shy of its prior all-time high (tip of the hat to Bloomberg News for that little factoid). If the S&P 500 does make it back to a new high within the next month, it will be the quickest transition from bear to bull on record (taking out the July – October 1990 experience). The not so good news is that cyclical leadership is starting to wane, and this is now the fourth attempt at 2,800 in the past four months and each one was met with a stiff resistance and an opportunity to take some profits and chips off the tables (maybe sell some call options).
There is little new news on the U.S.-China trade file to report on, except that it now looks obvious that the March 1st deadline will be extended. But just as a thaw on this front has appeared, the Trump trade team just opened a war on a different front with the EU, threatening auto tariffs – as the President just said, “if we don’t make a deal, we’ll do tariffs.” As far as Brexit is concerned, right after James Corbyn faces seven defections from his party, three MP’s just left the Conservatives which has weakened Theresa May’s hand and so the odds of a destabilizing exit on the expected March 29th departure date cannot be ruled out (and no at all priced into the market).
Now I have to make this final point and make it emphatically. Central banks continue to matter and maybe now more than ever. [Emphasis mine.] Those of us that have been cautious on the markets have rightly said time and again in this two-month bounce back that prices have gone to reflect a whole lot of potential good news from a successful resolution to the trade file, to Chinese stimulus to a Brexit solution. But there’s no sense complicating things.
Since early February, Fed official after Fed official has come out and told investors “we hear you.” Back in December when Powell tightened into the market maelstrom, threatening two more hikes and a balance sheet downsizing on “autopilot,” the sharp slide in ensuing week was the message from Mr. Market to the Fed to effect that “buddy, you are tone deaf.” So the risk back in December was that the Fed was just going to keep tightening, damn the torpedoes, full steam ahead. But that didn’t happen. The Fed has backed off. Powell didn’t wait years and ended up apologizing in a book like Ben Bernanke did – he wasted no time in doing so. And so we have to acknowledge that even if the markets have priced in some good news on various fronts (and perhaps prematurely) there is a reality that has to be accepted, which is that this market rebound has occurred amidst a very poor set of incoming economic data and a wave of downgrades to the earnings outlook.
But even with the profits backdrop challenged, the assumed discount rate being applied to that earnings stream has come down as well and this is a very powerful positive influence on equity values, pure and simple. That is what has happened, first and foremost. The markets believed in December that the Fed was on the precipice of making a huge policy error – and the central bank pulled back. End of story.
From my lens, the Fed had already overtightened and recession risks for this year are elevated and on the rise. Only history will be the arbiter of whether the downturn already got priced in during the setback in last year’s fourth quarter – I wouldn’t necessarily rule out a retest of those lows. But what is important is that the Fed is not going to allow any further steep correction beyond that, if it can, and Powell has already shown his hand in terms of where his “put” is… and it is at the December lows.
The Fed responded to those prior lows by doing a 180 degree shift in tone and rest assured it is not going to be just the tone that changes in the next corrective market phase but rates themselves.
So if there is one conviction I have, it is that front-end rates and bond yields out the curve will be melting before our eyes in the next 12-24 months. This obviously spells decent returns in the fixed-income market, but should also be a solid underpinning for high-quality, blue-chip, non-cyclical dividend-paying (growth and yield) stocks. North American Financials are first to come to mind, and this is from the resident bear.
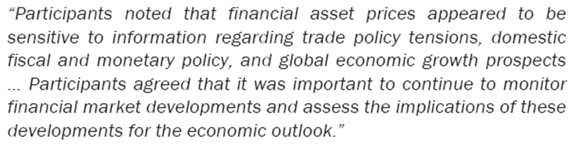
Below is the excerpt from the minutes I was referring to – like I said, it has the “I have your back” label written all over it, and arguably the most vital piece of information in yesterday’s document:
Free trial here: Contact Marcel Aulls at maulls@gluskinsheff.com and mention my name.
Not a recommendation to buy or sell any security. Opinions are those of David Rosenberg and do not necessarily reflect Steve Blumenthal’s or CMG’s views. See additional disclosures below.
Taxing Wealth Instead of Income? by Robert Eisenbeis, Ph.D.
First, it is important to understand the distinction between income – a flow of money from work and investments – and wealth – an accumulation of assets, things that we have. We all know that we can borrow to fund our acquisition of things, which then have to be financed out of our current income. Most recent proposals have actually focused on taxing net worth – reflecting the difference between what we owe and what we have.
While it is easy to refer to wealth in the abstract, it is important to recognize the wide range of assets that constitute our wealth. These include our homes, cars, financial assets, clothes, vacation homes, yachts, intellectual property rights, patents, etc. Some of these are easily valued while others are more problematic. One of the most recent wealth tax proposals would tax net worth over $10 million at 2% and net worth over $1 billion at 3%.
One of the interesting points about the wealth tax is that it taxes net worth – our things – each year, whereas an income tax is based on our current year’s income. Here is an interesting thought experiment. Suppose you have $1 billion, and it is taxed 3% every year. In 10 years, assuming the principal was not invested, you would have slightly less than $750 million remaining, and in 20 years you would have about $540 million. So, in effect, the government is saying that you have too much stuff and they are going to take it. In the extreme, this is not really different from the government saying that you have too many cars or that your house is too big and, therefore, you must let someone use one of your cars or one or two of your rooms at your expense.
More seriously, it is interesting to look at how the composition of wealth differs over classes of different net worth. The Federal Reserve’s survey of consumer finances contains information that allows us to get a better picture of how the distribution of stuff differs across different wealth cohorts. For the lower tiers, real estate, autos, retirement funds, and liquid assets comprise the bulk of net worth. At the other extreme, for those with a net worth in excess of $1 billion, the target cohort for the net worth tax, those same assets are a minuscule portion of their net worth (See Chart, “What Assets Make Up Wealth?” at https://www.visualcapitalist.com/chart-assets-make-wealth/).
More than two thirds of the wealth of the $1 billion net worth cohort is composed of what is termed “business interests.” The Survey of Consumer Finances divides “business interests” into those business interests in which the owner has an active management role and those in which the owner does not play an active role. Well over 90% of such business interests constitute active management. Thus those who wish to tax wealth rather than yearly income are, in fact, targeting mainly privately held business interests whose value is derived from the active entrepreneurial involvement of the principal and his or her family (1). Such assets are hard to identify, since they can include loan guarantees, intellectual property, etc. Those business interests are not frequently traded and are extremely hard to value. These are the same business interests that generate employment and benefits to many others. To implement a tax that serially requires a potential long-term expropriation of and monetization of productive businesses activities in the name of funding other social objectives requires very careful review and analysis of the costs and benefits.
The same survey also shows that one of the main determinants of wealth is education, and the returns are greatest to a college education (2). To be sure, we have recently heard about the problems of excessive student debt, and a recent Wall Street Journal article convincingly shows that students who attend but don’t finish college can be even worse off than those who don’t have a college degree (3). However, that same article also shows that unemployment rates are lower among college graduates and those with some college than for those with no college, and earnings show a similar pattern.
We need to remember that our Declaration of Independence promotes the “pursuit of happiness,” which has come to mean equal opportunity, not equal incomes or equal wealth. Given the evidence on education and well-being, we need to consider whether the key to dealing with the so-called problems of income and wealth inequality may be education and not government redistribution policies. Maybe we should focus on programs to raise those on the bottom while taking advantage of the often philanthropic tendencies of people with large accumulations of wealth. Perhaps we should consider policies, as just one example, that reduce inheritance taxes if a wealthy individual donated some of his or her wealth in advance of passing, provided that the gifts are to support qualified educational initiatives and keeping people in college who otherwise might be forced to drop out. This provides a carrot and opportunity for a wealthy individual to do good and avoids government expropriation with no guarantees that the funds will be used to address a social problem.
Robert Eisenbeis, Ph.D.
Vice Chairman & Chief Monetary Economist
Sources:
- “Changes in U.S. Family Finances from 2004 to 2007: “Evidence from the Survey of Consumer Finances,” Brian K. Bucks, Arthur B. Kennickell, Traci L. Mach, and Kevin B. Moore, revised 2009, Federal Reserve Bulletin, Vol. 95, 2009, https://www.federalreserve.gov/pubs/bulletin/2009/articles/scf/default.htm.
- Ibid.
- https://www.wsj.com/graphics/calculating-risk-of-college/
Links to other websites or electronic media controlled or offered by Third-Parties (non-affiliates of Cumberland Advisors) are provided only as a reference and courtesy to our users. Cumberland Advisors has no control over such websites, does not recommend or endorse any opinions, ideas, products, information, or content of such sites, and makes no warranties as to the accuracy, completeness, reliability or suitability of their content. Cumberland Advisors hereby disclaims liability for any information, materials, products or services posted or offered at any of the Third-Party websites. The Third-Party may have a privacy and/or security policy different from that of Cumberland Advisors. Therefore, please refer to the specific privacy and security policies of the Third-Party when accessing their websites.
Sign up for Cumberland Market Commentaries
Trade Signals – No Significant Changes; Equity Signals Remain Poised to Change
February 20, 2019
S&P 500 Index — 2,779
Notable this week:
No major changes this week. You’ll see in the “Dashboard” section above there are a number of trend signals nearing buy signals. Shorter-term signals, like Volume Demand vs. Volume Supply have recently turned bullish. I favor intermediate-trend signals to minimize trading and whipsaws. One of the most popular trend rules is called the “golden cross.” It occurs when the 50-day moving average (an intermediate-term trend measurement) crosses above or below the 200-day MA trend line (a long-term trend measurement). Signals indicate the market is rising in the short term relative to the long term (a bullish signal) or falling (a bearish signal). You’ll find the 50-day vs. 200-day MA chart on the S&P 500 Index below. It is currently in a sell signal.
The Ned Davis Research CMG U.S. Large Cap Long/Flat model remains in a sell signal. There is modest improvement. It is designed to catch the major market trends, not the short-term moves.
Bottom line: There is some improvement in the model. It is built to give the upside the benefit of the doubt. When the model equity line score (currently 58.54) becomes higher than its score 42 days ago, a confirmed uptrend signal will be generated and the model will signal 100% exposure to U.S. large-cap equities.
The Ned Davis Research sentiment indicators — the Daily Trading Sentiment Composite and Crowd Sentiment Poll — are both showing extreme optimism, which is short-term bearish for equity markets.
Risk of global recession remains high, while there’s currently low but growing U.S. recession risk. We’ll continue to remain data dependent (recession watch charts below). The recession data updates monthly.
Click here for this week’s Trade Signals.
Important note: Not a recommendation for you to buy or sell any security. For information purposes only. Please talk with your advisor about needs, goals, time horizon and risk tolerances.
Personal Note – Powder Snow
Monday evening I board a flight to Salt Lake City. I’m meeting with a dozen ski-crazed, powder-seeking friends. We are arriving a day ahead of a Winter Investment Symposium in Park City, Utah. A mountain cabin is rented and a team of professional back-country experts assembled. Tuesday will be an all-day powder skiing day. It’s really hard to describe the feeling. The deep snow tends to check your speed while you float softly side to side down the mountain. It’s quiet, peaceful and when in the right balance, effortless. When you’ve got it just right, it almost feels like you’re floating on a soft cloud. I’m checking in a little heavy so effortless and floating may be elusive. But happy, nonetheless. The conference begins on Wednesday. Morning meetings and afternoon skiing. I present on Thursday.
My son, Matt, will be in Jackson Hole in mid-March. Dad’s trying to figure out how to get there for his weekend competition. On March 21, Ed Lopez of VanEck and I will participate on a panel called “Market Pulse: A Beacon in the Storm,” at the Barron’s Independent Summit, hosted at The Grand America in Salt Lake City, UT. Austin follows on April 3 and Dallas on April 4 with John Mauldin for evening speaking engagements and back to Utah for a week of vacation April 5-12.
David Rosenberg will be the lead-off hitter, as he is every year, at Mauldin’s 2019 Strategic Investment Conference on May 13-16 in Dallas. I remember when I used to listen to Rosey over the “squawk box” when I was a young Merrill Lynch financial advisor. Loved his work then and even more today.
The cost of the conference has gone up, but I was able to arrange a special price if you are interested in attending. I hope to see you in Dallas on May 13-16. You can learn more and register here: Mauldin Economics 2019 Strategic Investment Conference.
I hope this note finds you well and doing something fun for yourself. Life is too short… Wishing you a great weekend. Thank you for reading On My Radar. Please know how much I appreciate you and the time you spend with me each week.
Best regards,
Stephen B. Blumenthal
Executive Chairman & CIO

