
With China’s economy under pressure on a number of fronts, the PMI takes on a new level of importance – particularly so as global markets come under pressure and with China growing to become the world’s second largest economy… it makes sense to place due attention here.
Q3 hedge fund letters, conference, scoops etc
On with the results. The manufacturing PMI fell by 0.6 points to 50.2 (vs expected 50.6, and previous 50.8), while the non-manufacturing PMI also fell by 1.0 points to 53.9. Across the major sub-categories, in manufacturing medium sized firms fell the most -1pt to 47.7 …add to that the point that manufacturing export orders fell to a 34 month low of 46.9 and it’s clear the trade war is distinctly making its impact felt.
Within non-manufacturing index, the services index was down -1.3pts to 52.1 and the construction index was *up* 0.5pts to a booming 63.9. That last point is important as I previously highlighted 2 key rotations underway in the Chinese property market (presents upside risk to base metals). Indeed, at this point the strength in the property sector is providing an important offset to the economic downdrafts China is facing.
On with the charts – here’s 2 of my favorite China PMI charts.
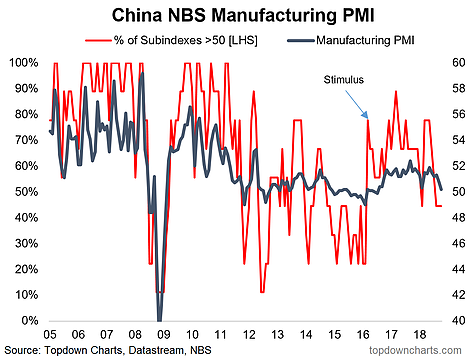
- China Manufacturing PMI: The first focuses on the official manufacturing PMI – visually you can see it’s at the weakest point since around the time the 2016 stimulus was announced, and the breadth across sub-indexes has likewise remained weak. So back to the title of this blog – my question I think should be asked is “is it weak enough yet?” –> my view is when China slows a little it’s a bad thing for EM and commodities, but when China slows a lot, it’s a good thing because it prompts policymakers to undertake stimulus and hence provide a real economic and sentiment boost to those asset classes. My view is we’re getting closer but not quite close enough.
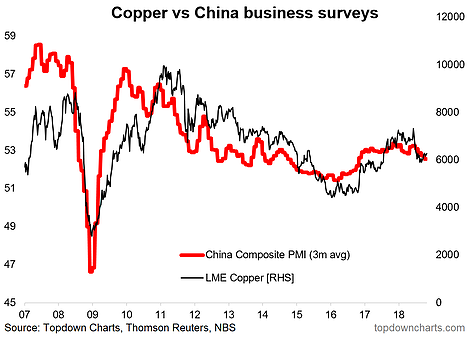
- Composite PMI vs Copper Price: Another key chart, and a running feature within my client reports is the copper price vs the smoothed composite China PMI. For logical reasons these two move closely together (China accounts for around half of global copper demand). So the softening in the PMIs is basically being confirmed here by the weaker copper prices – a risk I talked about late last year. From here I think both are close to a bottom given the weight of evidence, but it may take some more pain before a credible catalyst emerges to drive copper prices higher.
As I noted, the results are clearly and consistently across the board weaker vs last month and materially weaker vs the start of the year. Previous policy tightening and the adverse real and sentiment effects of the trade war have exerted headwinds on the Chinese economy, and while property may offset this partially, we’re likely getting closer to policymakers’ pain point in China. So the results are soft, yes, but likely not quite soft enough to drive more forceful stimulus.
Looking for deeper insights? Take a look at our institutional research service
Article by Top Down Charts

