
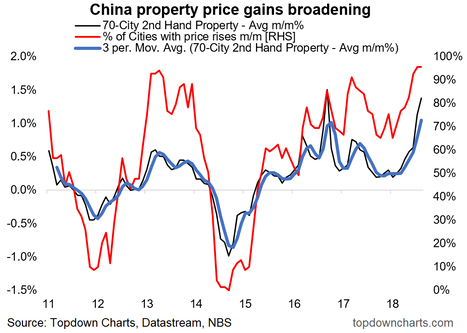
August brought another month of (accelerating) property price gains in China. Monthly price gains accelerated to a blistering average gain of 1.4% m/m, with ex-tier-1 cities driving the gains. Price gains were broad-based also, with 96% of cities seeing price gains month on month. With economic policy uncertainty for China at very high levels, basically what we can construe from the data is that policy makers have opted for stimulus over reform, and property investment over property affordability. If these gains are sustained we’ll have to start thinking about upside risks for EM and commodities, but I am still skeptical (bearish) on the cyclical property outlook.
[REITs]
Q2 hedge fund letters, conference, scoops etc
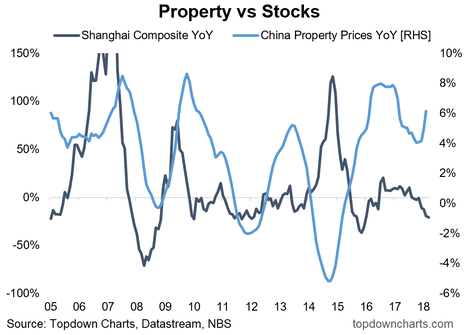
BONUS CHART: An interesting accompanying chart is the path of property vs stock price gains (Shanghai Composite). With Chinese stocks materially underperforming this year (trade wars, previous tightening, previous softening in property, currency concerns), it looks like the marginal speculative investment dollar has gone back to the property market…
Article by Top Down Charts

