
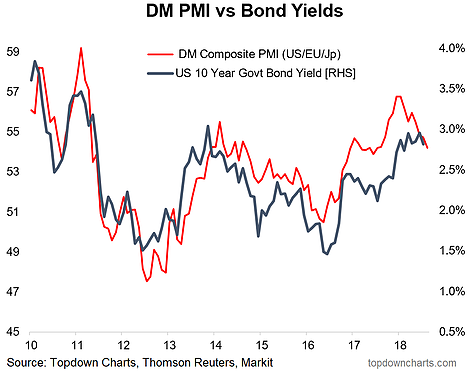
Another bond/macro chart, here’s the flash composite DM manufacturing PMI against the US 10 year bond yield. The composite DM flash PMI (we construct using Markit data and IMF GDP weights) dropped -0.5pts in August to a 14 month low of 54.2. Japan bucked the trend, up +0.2pts to 52.5, while the US dropped the most, down -0.8pts to 54.5 and Europe also down -0.5pts to 54.6. The chart is helpful in explaining why the upturn in bond yields has stalled, at least for now.
[timeless]
Q2 hedge fund letters, conference, scoops etc
The initial turnaround in the DM composite PMI from near-recessionary conditions in early 2016 drove much of the initial push higher in yields. From here for yields to keep going higher we’re going to need to either see a stable PMI and higher inflation or another tick up in the PMIs. Of course, if the PMI continues to fall it will provide weight to those outlining the bullish case, with many referencing the possible head and shoulders top in the 10-year bond yield.

Looking for deeper insights? Try taking a free trial of our institutional research service
Article by Top Down Charts

