
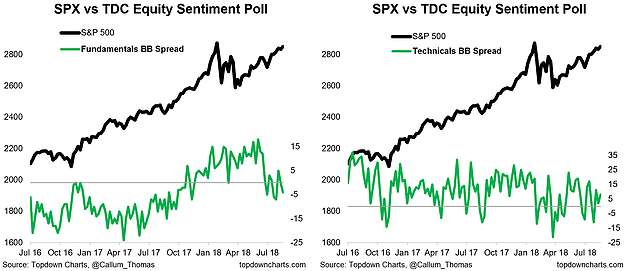
Aside from the weekly S&P500 #ChartStorm, a regular practice of mine is to survey my followers on Twitter to ask them whether they are bullish or bearish for primarily fundamental or technical reasons. I’ve been tracking the results of this survey for about 2 years now and some interesting patterns are emerging, especially lately. The spread between bulls and bears for “technicals” vs “fundamentals” have both changed recently. But the stand out is the fundamentals – after a period of fundamentals euphoria since late last year, this sort of fundamentals FOMO has turned to more of a fundamentals furrowing of the brow as EM stress, Fed tightening, and political risk weighs on the outlook. Meanwhile the technicals bull/bear spread looks notably less convicted lately. Call it a healthy reset or a turning of the tides, but something is going on here.
[REITs]
Q2 hedge fund letters, conference, scoops etc

Bonus chart: here’s a chart of the equity fundamental net-bulls smoothed (4 week average) against the same line from the bond version of the survey. Notably the bond investors seemed to flag this softening in sentiment in advance, and for now both are in a holding pattern. With the earnings growth outlook still very bullish, the key question is whether EM stress, Fed tightening, and political risk can be shaken off or whether the US markets finally get shaken out.
Article by Top Down Charts

