
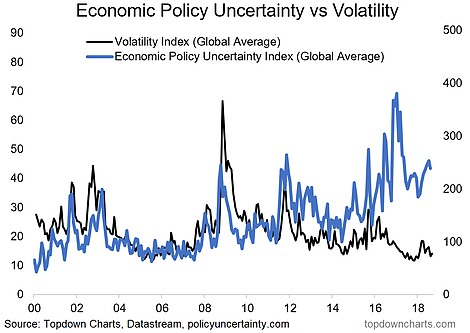
Economic policy uncertainty, and political risk in general has basically been a constant over the past few years. In more recent times the trade war, EM stress, and Fed QT are among examples of policy risks weighing on investors’ minds. And that last point is something worth pondering – in an environment of super-accomodative monetary policy globally, these elevated levels of policy uncertainty were bearable, or even negated by the vast stimulus being pumped into the global economy. But now that stimulus is being removed, and policy normalized, policy uncertainty will start to become a more meaningful headwind and driver of risk.
[activistinvesting]
Q2 hedge fund letters, conference, scoops etc
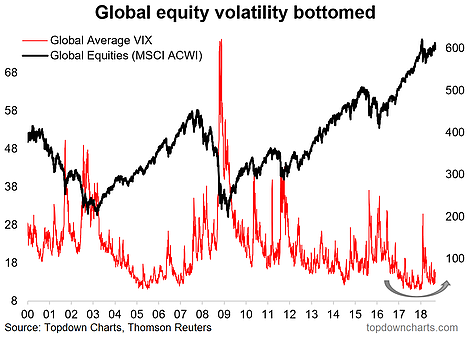
BONUS CHART: This chart shows the path of the global average implied volatility index vs the MSCI ACWI (the main global equity benchmark). It comes from “The Charts to Watch in 2018” – back when I first featured this chart I noted how the 3 key themes of: higher valuations across asset classes, a maturing business cycle, and a turning of the tides in monetary policy, would make for a more challenging environment for global investors… this has proven to be the case so far this year, and it’s looking increasingly like a cycle bottom has been seen in volatility.
Article by Top Down Charts

