
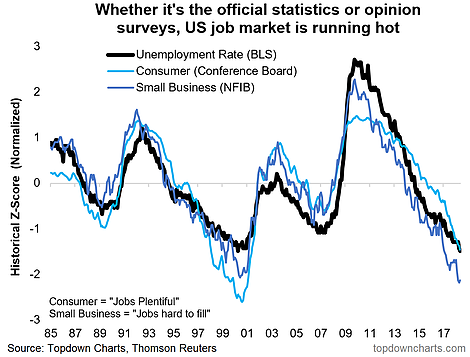
The US job market is running hot, and that statement is true whether you measure it by the official unemployment rate, or by the consumer confidence survey (consumers saying jobs are plentiful), or by the small business survey (small businesses saying jobs are harder to fill) [chart shows z-scores of these metrics]. Indeed, the last time we saw anything like this was during the go-go 90’s where the economy was running hot and the stock market even hotter. This is an unequivocal sign of strength and a sign of tight capacity. The problem with tight capacity is that it typically leads to price pressures. And price pressures typically drive monetary policy tightening, so if there is one takeaway from this chart, it would be that maybe we can expect an even more aggressive tightening stance from the Fed in the coming months and quarters. This is not really a shocking insight, it’s basically what you usually see at this stage of the cycle. Still, it’s the kind of thing that will add impetus to US dollar strength.
Q1 hedge fund letters, conference, scoops etc, Also read Lear Capital: Financial Products You Should Avoid?
Follow us on:
LinkedIn https://www.linkedin.com/company/topdown-charts
Twitter http://www.twitter.com/topdowncharts
Article by Top Down Charts

