
Value on Country Level
Q1 hedge fund letters, conference, scoops etc
SUMMARY
- A global value portfolio on country level features structural country biases
- Returns were positive since 1990, but lacked consistency
- Value on country and single stock level exhibit the same trends, highlighting common performance drivers
INTRODUCTION
Holding Value stocks is emotionally challenging as cheap valuations are usually due to companies experiencing temporary or structural issues such as declining sales, a lack of strategy, poor management, excessive leverage, or a combination of these. Investors might expect to get compensated for holding painful stocks and indeed research highlights positive excess returns over the long-term. However, the strategy has not been rewarding over the last decade. All pain, no gain.
An alternative to selecting single stocks is to focus on entire countries and rank these as cheap or expensive. The rationale for abnormal returns from buying cheap stocks should apply on country level as well. From the perspective of a current Value portfolio, this might result in replacing the shares of Deutsche Bank with indices for Greece or Portugal, which are two countries that have been trading cheaply in recent years given structural problems in their economies.
Perhaps buying cheap and selling expensive countries has been performing better than the same strategy on single stock level and presents an attractive alternative for harvesting returns from the Value factor. In this short research note, we will investigate Value on country level.
METHODOLOGY
We focus on the Value factor in a universe of 25 developed stock markets, which are sorted by price-to-book and price-to-earnings multiples as well as an equal-weight combination of both. Fundamental data is aggregated from company to country level from all stocks with a market capitalization of above $1 billion. Beta-neutral, long-short portfolios are created by buying the 30% cheapest and selling the 30% most expensive countries. Portfolios are rebalanced monthly and each transaction incurs costs of 10 basis points.
BREAKDOWN OF THE GLOBAL VALUE PORTFOLIO
Investors might be concerned that buying cheap countries implies exposure to more risk, which it partially does. A breakdown of the global Value portfolio by countries from 1990 to 2018 reveals strong biases. We observe that countries like Austria (AT), Belgium (BE), Korea (KR), Hong Kong (HK), and Portugal (PT) dominated the long portfolio and rarely featured in the short portfolio, which implies that they were trading at low valuation multiples for long periods. The three most expensive countries were the US (US), Switzerland (CH), and Taiwan (TW).
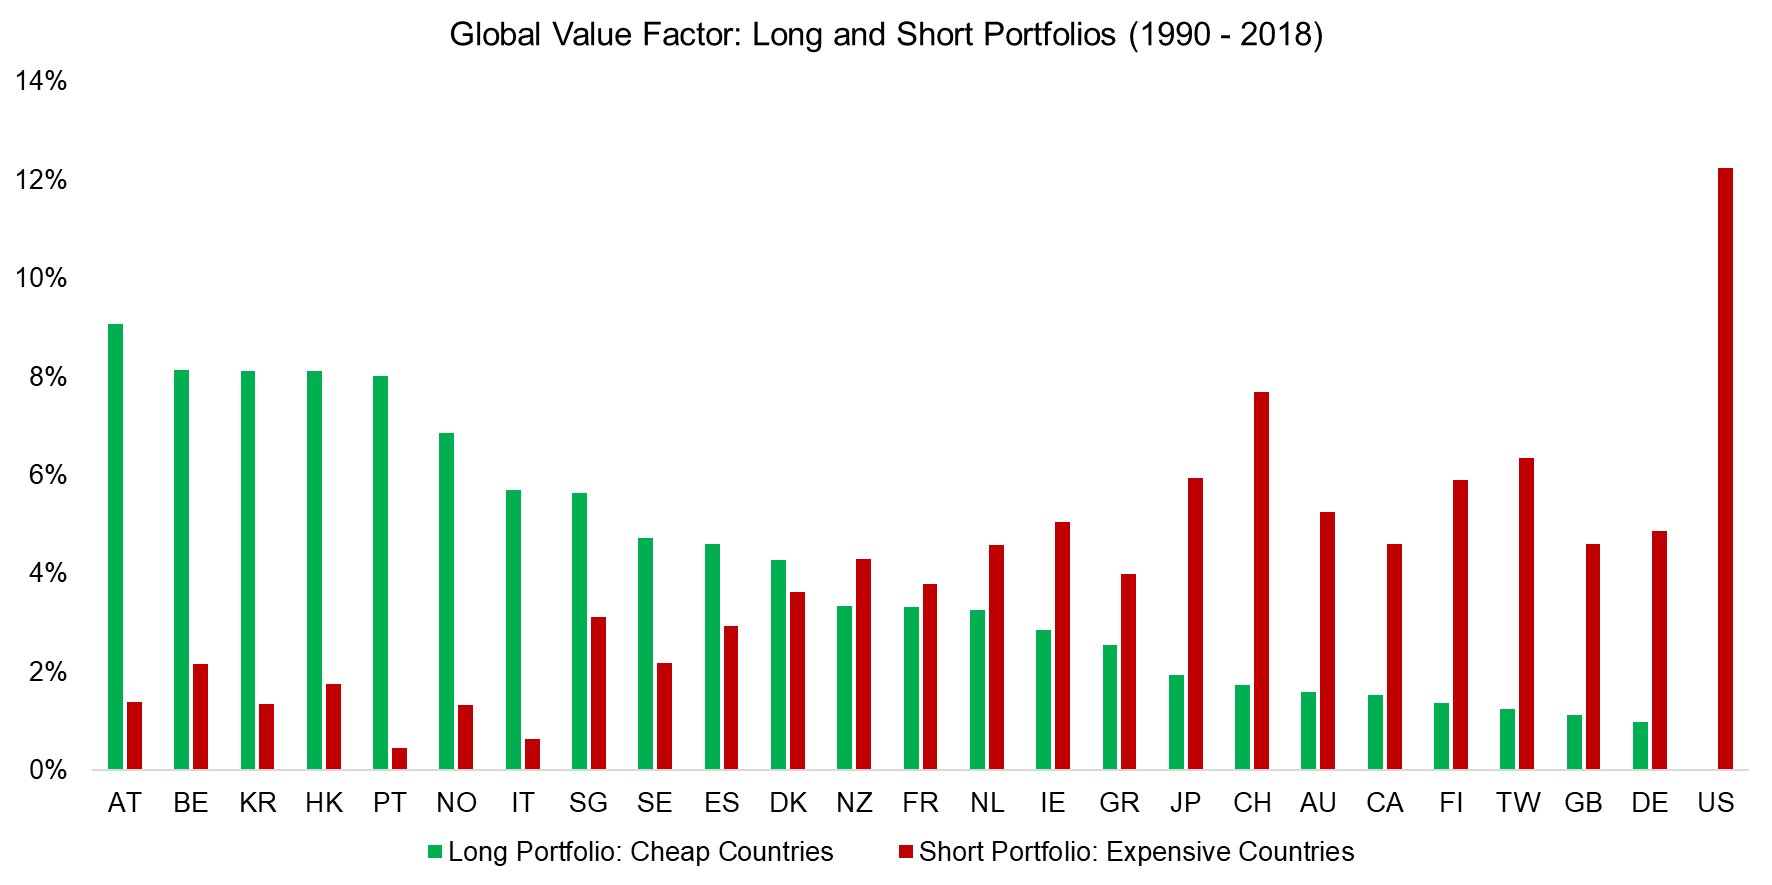
Source: FactorResearch
Multiple reasons explain the structural country biases, which include the following:
- Sector concentrations: Some countries feature strong sector biases. For example, the Taiwanese stock market is dominated by the technology sector, which has performed strongly over the last 30 years and is characterized by expensive valuations.
- Flight to safety: The Swiss franc is considered a safe currency, which reflects in Swiss stocks frequently being treated as quality stocks that are priced at premium valuations.
- Accounting differences: Most countries have adopted the accounting standard IFRS, which has some differences to US or Japanese GAAP. US companies are not required to mark-to-market assets likes investment properties, which reflects in stale book values. For example, McDonald’s book equity is negative, which theoretically makes it a very expensive company from a price-to-book perspective.
In order to mitigate some of these biases, we include a combination of price-to-book and price-to-earnings multiples that tends to be more robust than single valuation metrics.
GLOBAL VALUE FACTOR PERFORMANCE
The long-short Value factor on country level generated positive returns since 1990, albeit with a huge boom-and-bust cycle during the 30-year period, which highlights that factors are as cyclical as stock markets. The lack of consistency in returns makes this strategy challenging for investors as they are typically measured over the short-term.
It is interesting to note that the trends of the Value portfolios are identical, regardless if measured via price-to-book (PB) or price-to-earnings (PE) multiples.
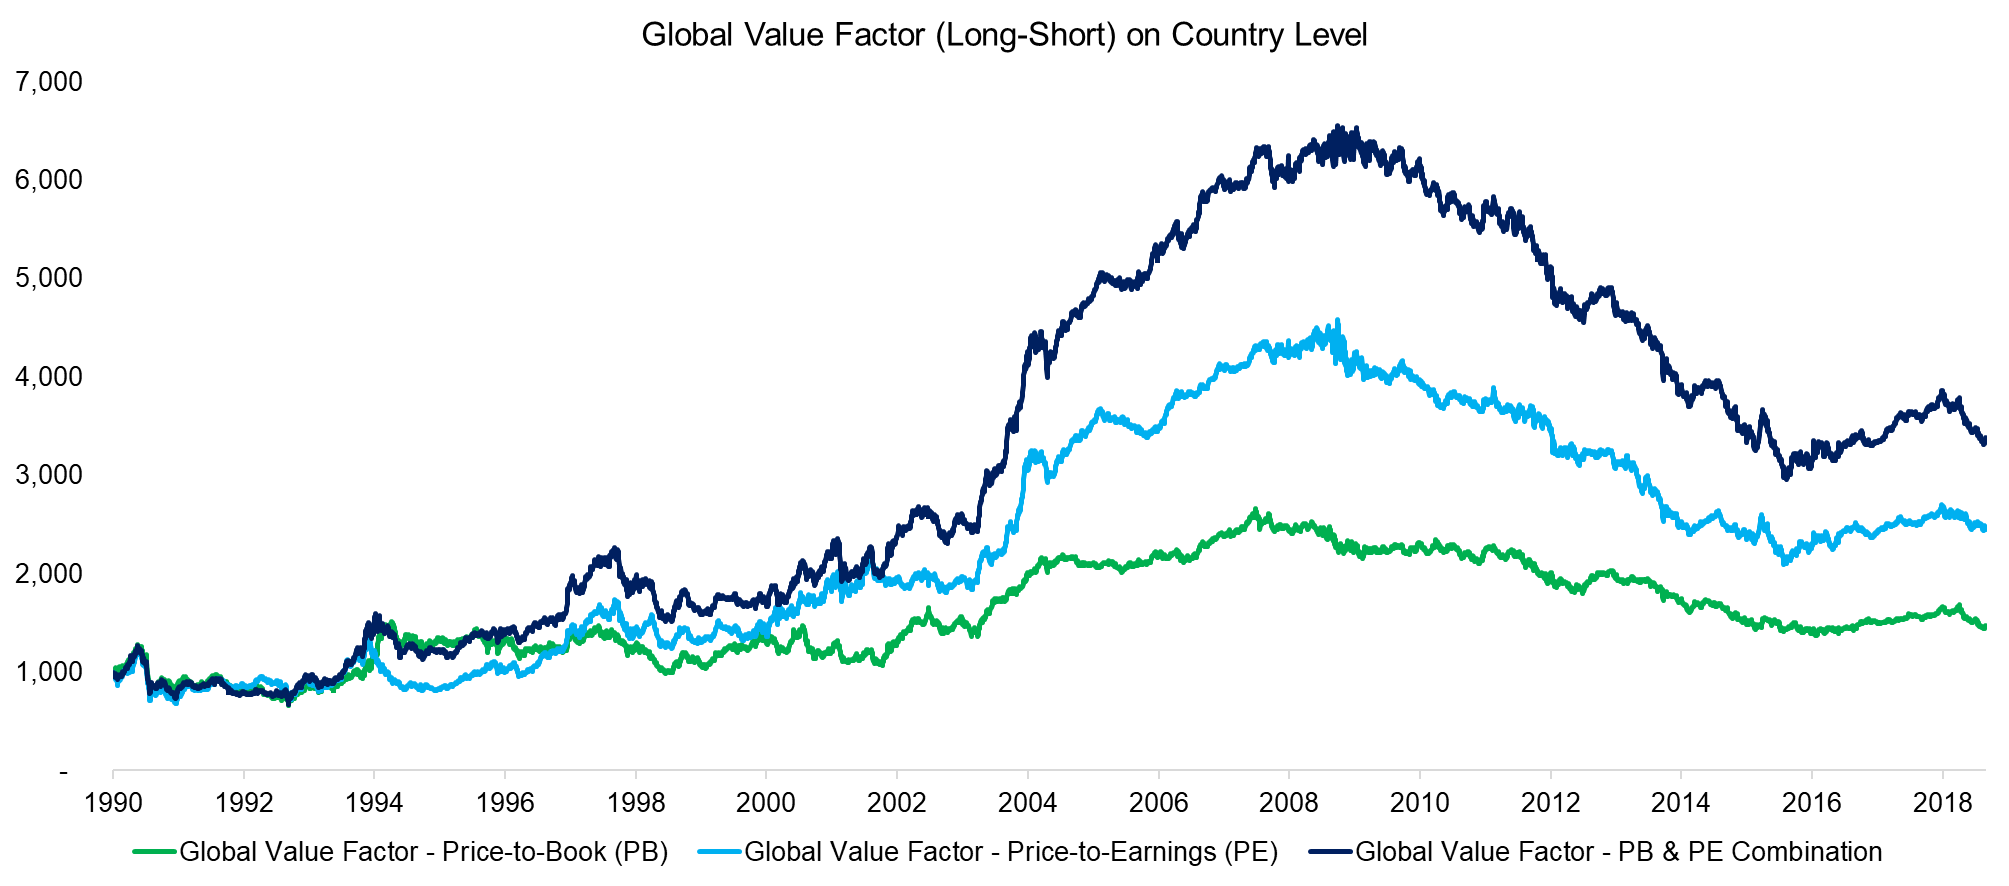
Source: FactorResearch
EUROPEAN VALUE FACTOR PERFORMANCE
The performance of a North American Value portfolio does not provide much insight as there are only two developed markets: the US and Canada. However, in Europe we have 16 countries and observe a performance that is comparable to that of the global Value portfolio.
Furthermore, there is again little difference between the portfolios, highlighting that the choice of valuation metric does not matter significantly. Investors might question if EV / EBITDA or cashflow-based multiples might show different trends in the Value factor, but our research shows that the performance on single stock level is comparable across metrics (please see Value Factor: A Comparison of Valuation Metrics).
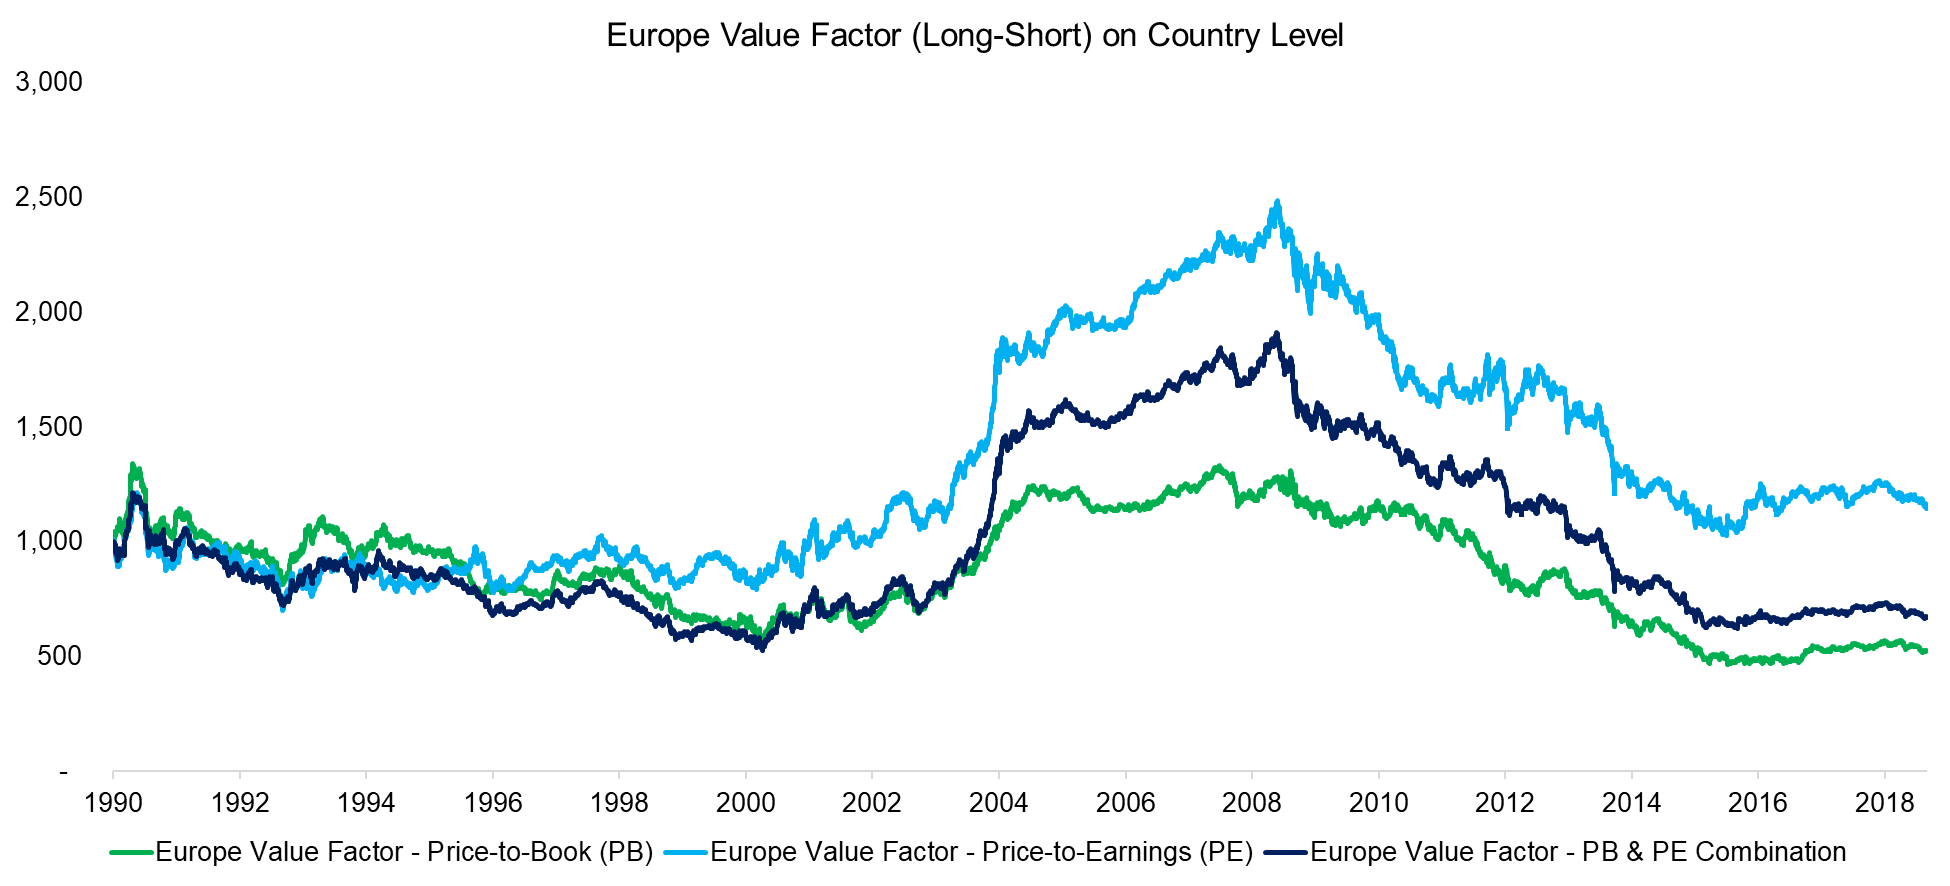
Source: FactorResearch
ASIAN VALUE FACTOR PERFORMANCE
Our data set includes only six developed markets in Asia, which leads to a concentrated Value portfolio consisting of two countries each in the long and short sides. The returns are more volatile than in Europe, where the portfolio is diversified across more countries. We observe that the price-to-book and price-to-earnings portfolios shared some trends, but also diverged in certain periods like during the tech bubble around 2000.
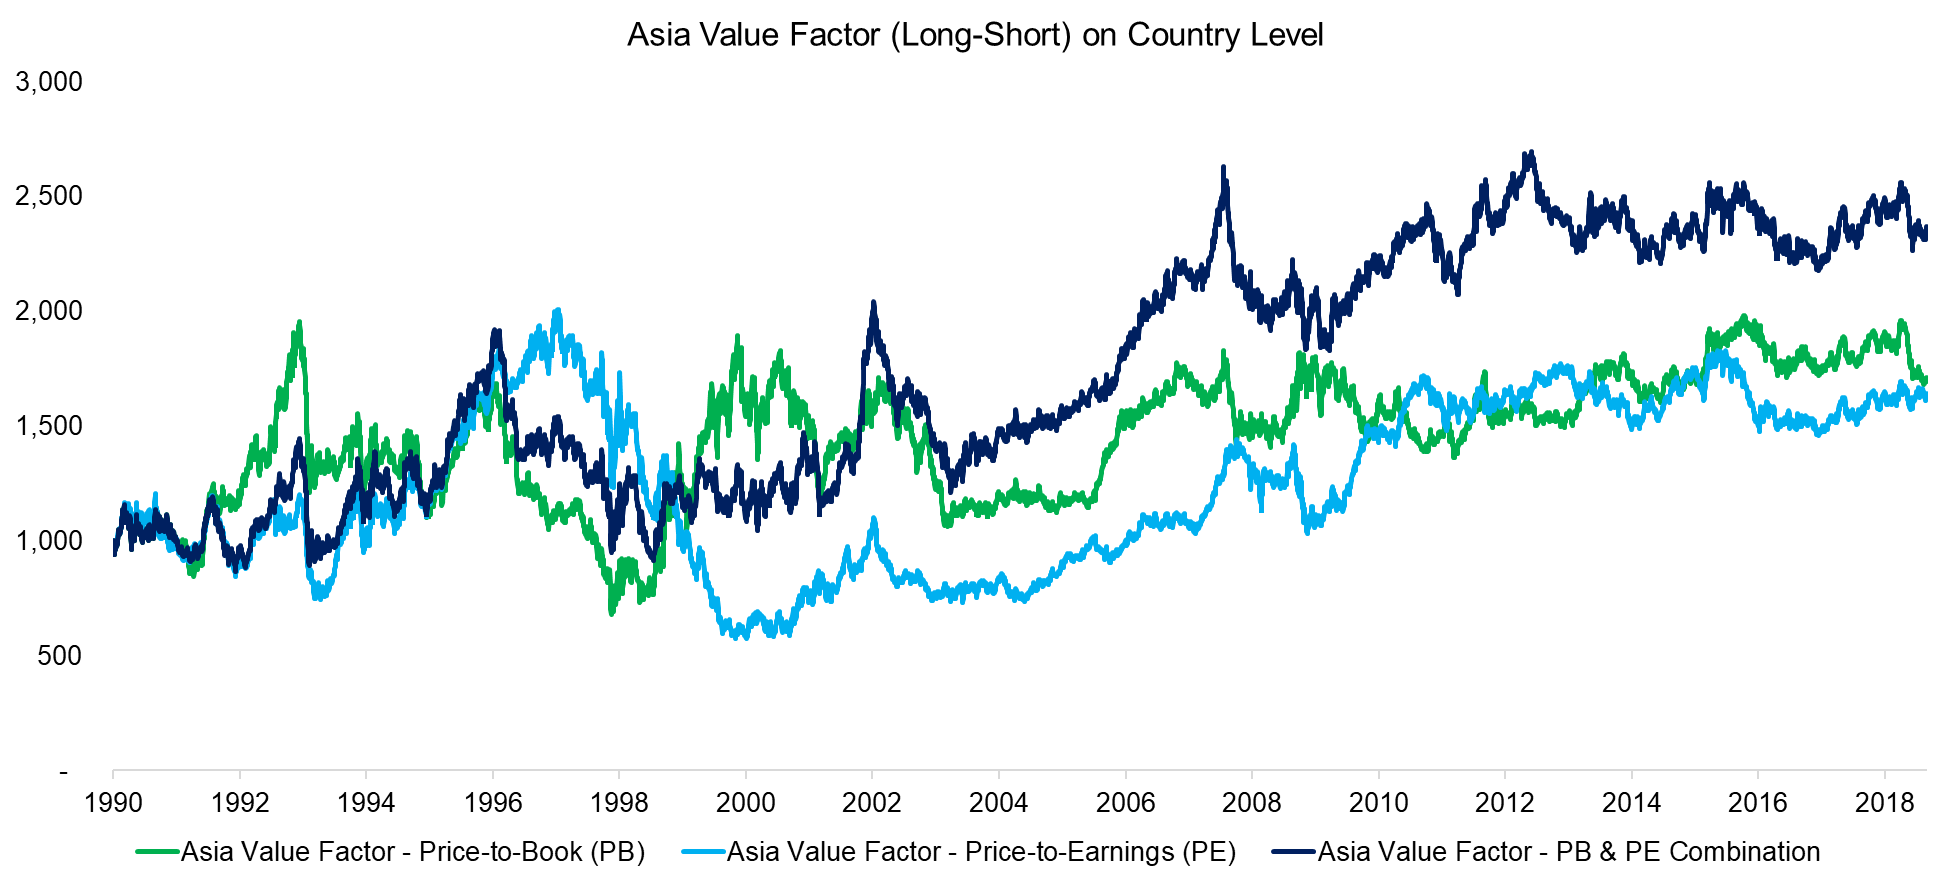
Source: FactorResearch
VALUE FACTOR: COUNTRY VERSUS SINGLE STOCK LEVEL
Comparing the performance of the Value factor on country versus single stock level reveals similar trends. The returns of both portfolios were flat between 1990 and 2000. Investors would have lost money by buying cheap and shorting expensive stocks during the tech bubble in 2000, while the performance from buying cheap and selling expensive countries was less affected. When the tech bubble collapsed, both portfolios generated significant abnormal returns. The performance since the global financial crisis in 2008 has been disappointing for investors.
Given that both portfolios show approximately the same trends, suggests that investors seek exposure to cheap stocks and cheap countries at the same points in time, which indicates common drivers of factor performance.
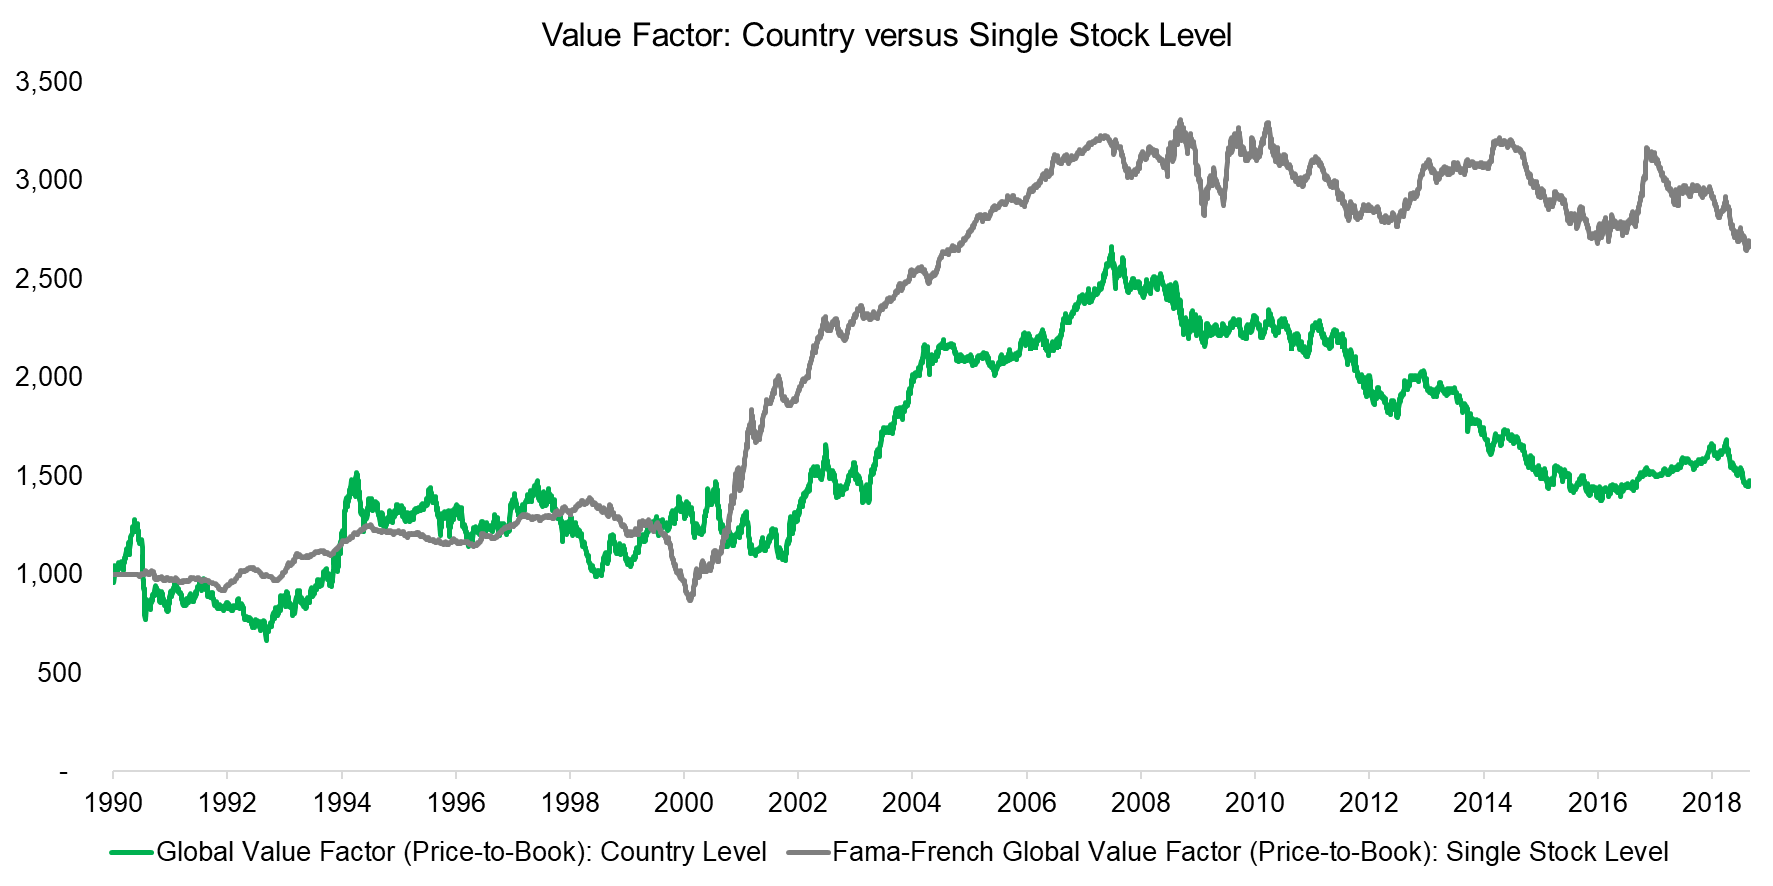
Source: Kenneth R. French Data Library, FactorResearch
FURTHER THOUGHTS
This short research note highlights positive returns from Value on country level over the last 30 years, albeit with little consistency. The factor performance was more attractive on stock than country level, but the Fama-French data on stock level excludes transaction costs, which overstates returns. It is also a complex portfolio to manage, given hundreds of securities. Harvesting returns from the Value factor on country level via ETFs and futures might represent an attractive alternative.
RELATED RESEARCH
Value, Momentum, and Carry Across Asset Classes
Value Factor: A Comparison of Valuation Metrics
ABOUT THE AUTHOR
Nicolas Rabener is the Managing Director of FactorResearch, which provides quantitative solutions for factor investing. Previously he founded Jackdaw Capital, an award-winning quantitative investment manager focused on equity market neutral strategies. Before that Nicolas worked at GIC (Government of Singapore Investment Corporation) in London focused on real estate investments across the capital structure. He started his career working in investment banking at Citigroup in London and New York. Nicolas holds a Master of Finance from HHL Leipzig Graduate School of Management, is a CAIA charter holder, and enjoys endurance sports (100km Ultramarathon, Mont Blanc, Mount Kilimanjaro).
Connect with me on LinkedIn or Twitter.
Article by Factor Research

