
Over the recent days, financial markets again has been dominated by the ongoing trade war between U.S. and China. However, prolonged negotiations are just one of many unsolved problems in Beijing.
Q1 hedge fund letters, conference, scoops etc
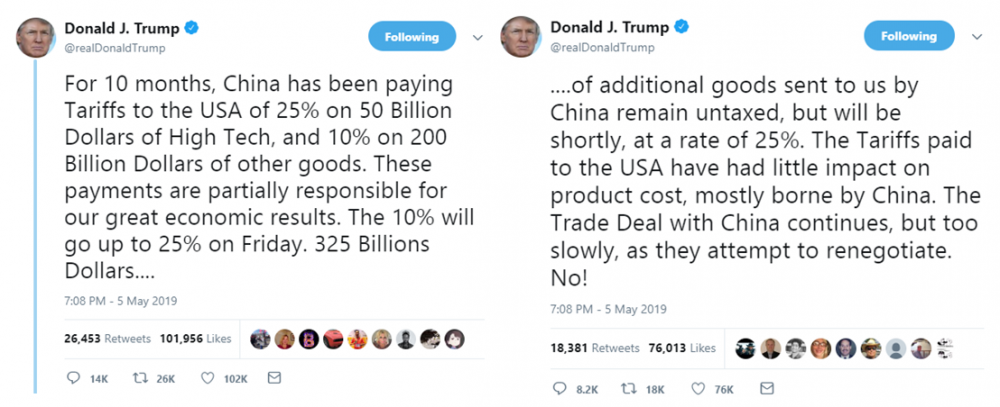
Donald Trump raises tariffs on Chinese products
On Sunday, May 5, President of the United States announced on his Twitter account tariffs increase on Chinese products worth 200 billion dollars from 10% to 25%. New duties have been implemented on Friday, May 10. Trump added in his tweet feed that 25% tarrifs on additional goods worth 325 billion dollars may be also imposed in the future.
After the announcement, indices in China recorded the strongest declines since January 2016. As it can be seen in the chart below, technology companies dropped by almost 8% (blue line), while the Shanghai Composite index, consisting of all companies listed on the Shanghai Stock Exchange, lost over 5.5% (red line).
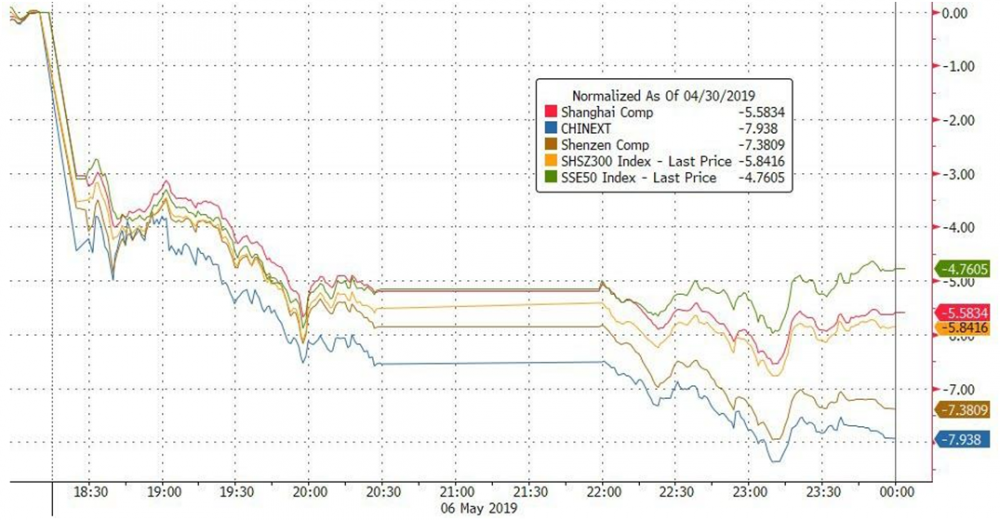
source: zerohedge
In the U.S., at the beginning it looked similar – futures contracts on stock indexes were significantly losing, till the market opening. During the session, however U.S. indices recovered almost all loses, closing the day slightly below zero.
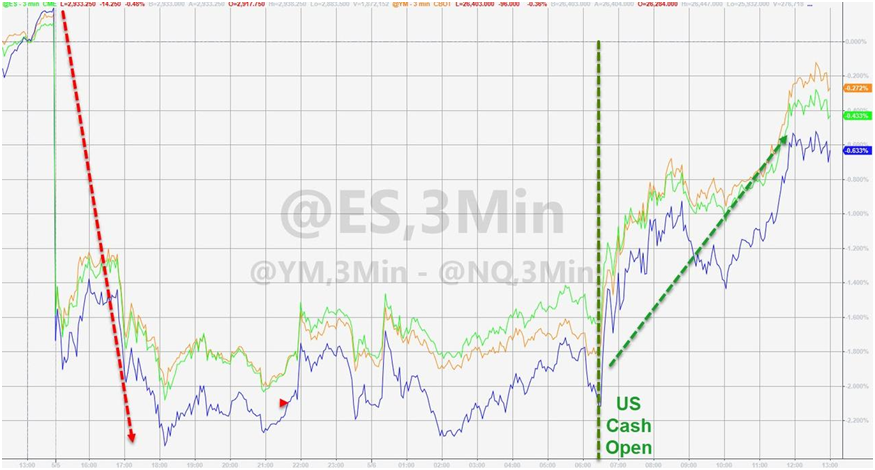
source: zerohedge
During the following days, investors in the U.S. were slowly losing faith in a quick deal between U.S. and China, as a result stock prices on the American stock exchanges dropped by several percent. However, declines in the Middle Kingdom were much stronger.
Why do we mention this? The above situation shows sensitivity of Chinese companies to any threats related to the ongoing trade war. For this reason, investors are very concerned about further developments in the Middle Kingdom. Continuing sell-off of Chinese shares is a very good proof of that – over the last week foreign investors dumped stocks worth 3.8 billion yuan (555 million dollars), which was the biggest weekly sell-off in history.
China’s problems, however are much greater.
Debt problem
To better understand how problems within China were developing let’s go back in time a few years. In the aftermath of financial crisis in 2018, economic growth sharply decreased. As a result, Communist Party decided to massively pump investments using debt. Party leaders assumed that economic growth should remain at a minimum level of 8% per annum. As it is shown in the chart below, GDP growth in China managed to stay above assumed 8% only until 2012.
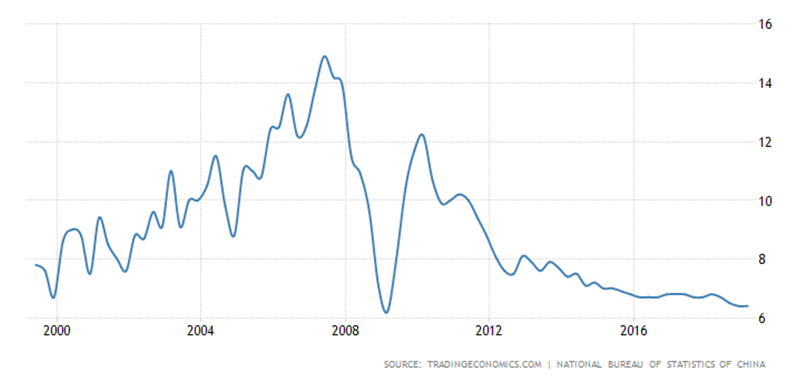
We can observe decreasing economic growth rate in China for a long time now, which is currently only 6.4% (the same as it was at the bottom of financial crisis 10 years ago). It should be emphasized that all data releases in China are only for a point of reference (even Chinese officials admit it), and in reality economic growth is much lower.
Nevertheless, as a result of the policy applied by the Communist Party after crisis, China has experienced several years of economic recovery, which resulted in a gigantic increase in debt. Total debt to GDP is currently around 270%. This means that debt since the crisis has almost doubled!
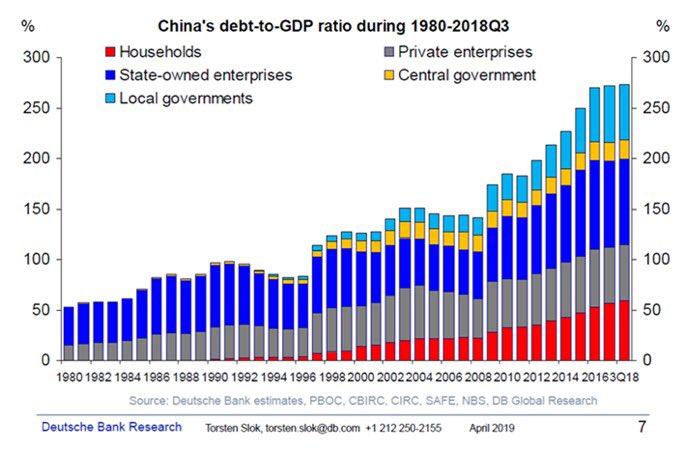
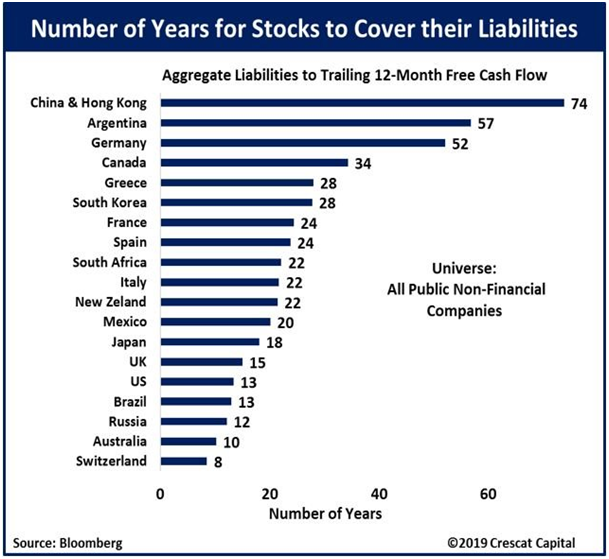
Chart shows that the largest share in debt is held by state-owned enterprises (dark blue) and local governments units (light blue). Over the last 20 years, a huge increase in household debt (red) have been also observed. In addition, Chinese companies have a significant problem. According to Bloomberg, companies in China and Hong Kong (excluding banks) would need 74 years to pay off all their liabilities using free funds. For comparison, in Argentina (country which regularly announces bankruptcy) 57 years are needed, In Greece (so called euro – bankrupt) 28 years.
Corporate debt – problem of insolvency
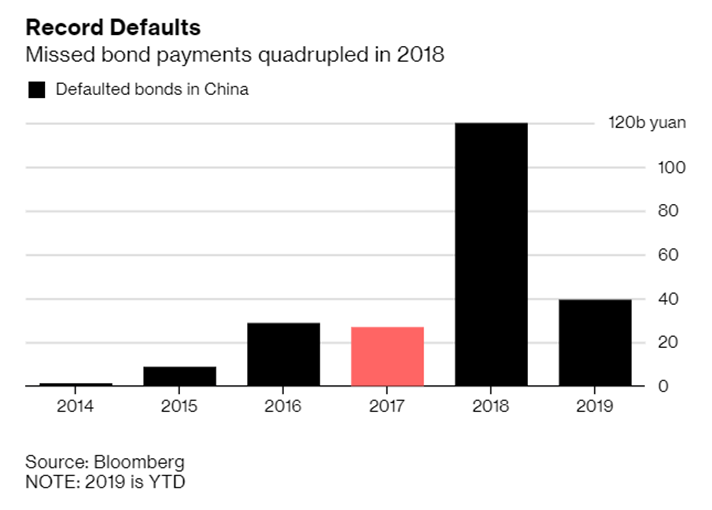
As we mentioned, the situation of many companies in the Middle Kingdom is dramatic, which negatively translates into their bond market. It is worth mentioning that it is 3rd largest market in the world, after Japan and the U.S., and its capitalization is worth about 13 trillion dollars. This is an equivalent of China’s annual GDP.
Along with growing bond market, companies’ insolvency is significantly increasing. Only in the first four months of 2019, enterprises in China did not meet their obligations to bond holders for 5.6 billion dollars. It is 3 times more than in the same period of 2018. If this pace continues, in 2019 we will see new insolvency record. In relation to the overall market value, it is still a small percentage, but in our opinion also these figures look worse in reality.
Despite the growing debt problem, China is trying to further stimulate lending of the corporate sector, especially small and medium-sized companies. On Monday, May 9, Bank of China announced another cut in reserve requirement ratio to 13,5%. As a result, banks will have an additional 280 billion yuan (41 billion dollars) to be used as loans to companies with financial problems. It is worth noting that this is a tenth cut of the ratio since 2014, when it was 20%.
On the other hand, Chinese officials along with President Xi Jinping are trying to reduce shadow-banking system (financial intermediaries who provide services similar to traditional commercial banks, but are not subject to traditional banking regulations). In effect, we come to a situation where commercial banks are reluctant to continue lending to companies with a poor financial conditions also, more restrictive regulations on shadow-banking make it impossible for these enterprises to borrow outside the banking system.
All these aforementioned factors translate into the economy state, and this one currently does not look bright.
Current situation of the Chinese economy
Chinese economy is very much dependent on exports and production (they account together for over 40% of GDP). In December 2018, export experienced a real shock, dropping 20% in relation to the previous year (black line on the chart). In the following months, we have seen a recovery. In April, however, exports dropped again, this time by 2.7%. Major impact on this had the decline in exports to the U.S., which decreased in April by 13.1%.
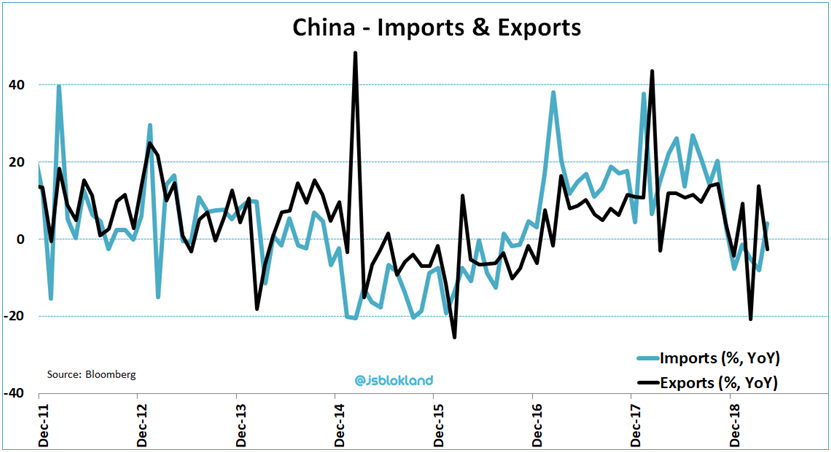
On the other hand, import after 7.6% decline in March, increased by 4% in April. It should be noted that import from the U.S. have drastically dropped, by as much as 25.7%.
Another alarming signal can be data flow from the automotive sector. We pay attention to this for two reasons:
a) when we are dealing with economic slowdown and likely occurrence of the recession, the automotive sector is one of the firsts which shows greater weakness;
b) it is the largest automotive sector in the world.
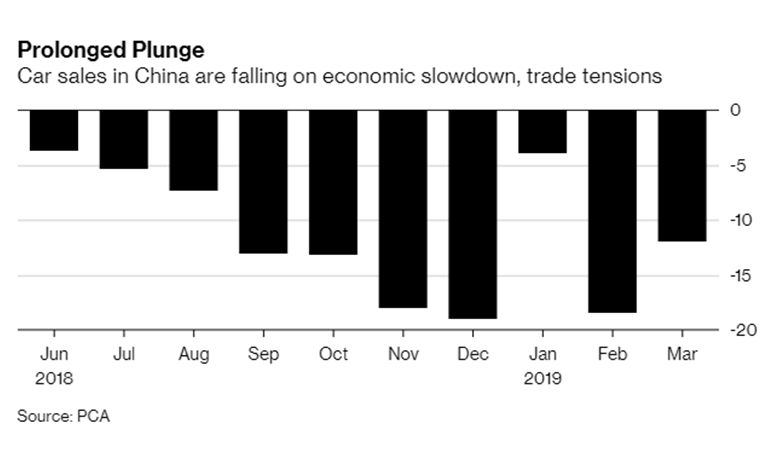
Chart shows that car sales in China has been declining over last several months. The worst month was December 2018 when sales dropped by almost 20%.
It should be emphasized that these weak economic data come in the period when the Bank of China and commercial banks facilitate credit access in various ways. Scale of this “support” for the economy in the first quarter of 2019 amounted to over 1 trillion dollars, or 9% of Chinese GDP. This is more accurately illustrated by the following monthly chart showing value of funds which went to Chinese enterprises and households.
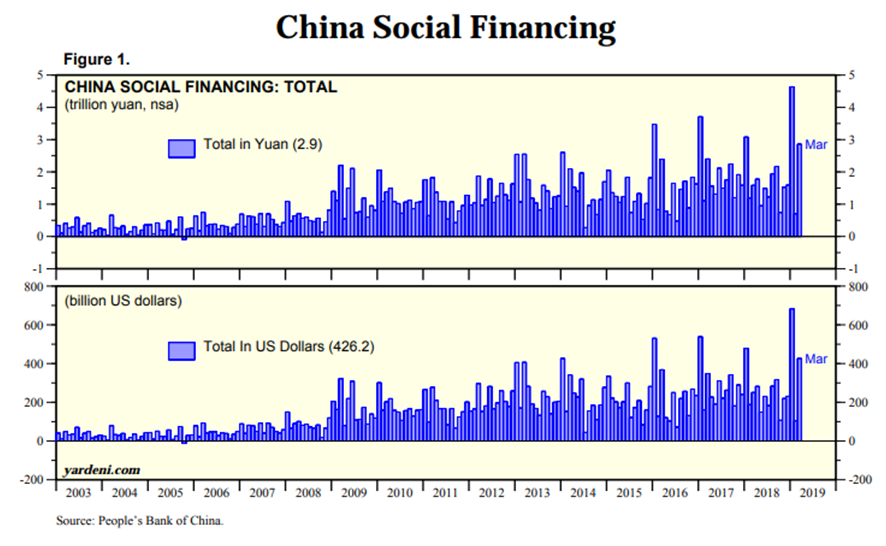
Upper part of the chart is shown in yuan, while lower part in dollars. It is easy to see that the first quarter of 2019 was record in terms of funds pumped into the financial system. Therefore, there is nothing surprising in Chinese stock exchange growth by more than 30% over this period (green line), which is twice as much as in the U.S. (red line) and Germany (blue line).
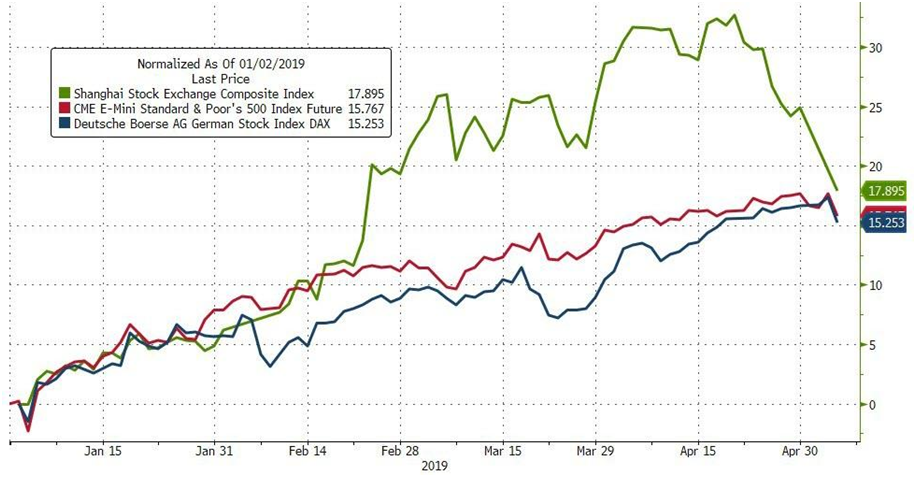
source: zerohedge
Subsequently, when liquidity injections has been limited, then immediate drops in share prices has begun.
Summary
Chinese policy after financial crisis of 2008 led to return of the economic growth. However, with the passage of time increasing debt became a significant problem for the second largest economy in the world. Weakness of the Middle Kingdom is already affecting related countries. This can be seen, among others, in the number of companies that in 2018 announced earnings worse than expected (top chart), as well as anticipated changes in 2019 profitability (bottom chart – value below zero means that company earnings are expected to decline).
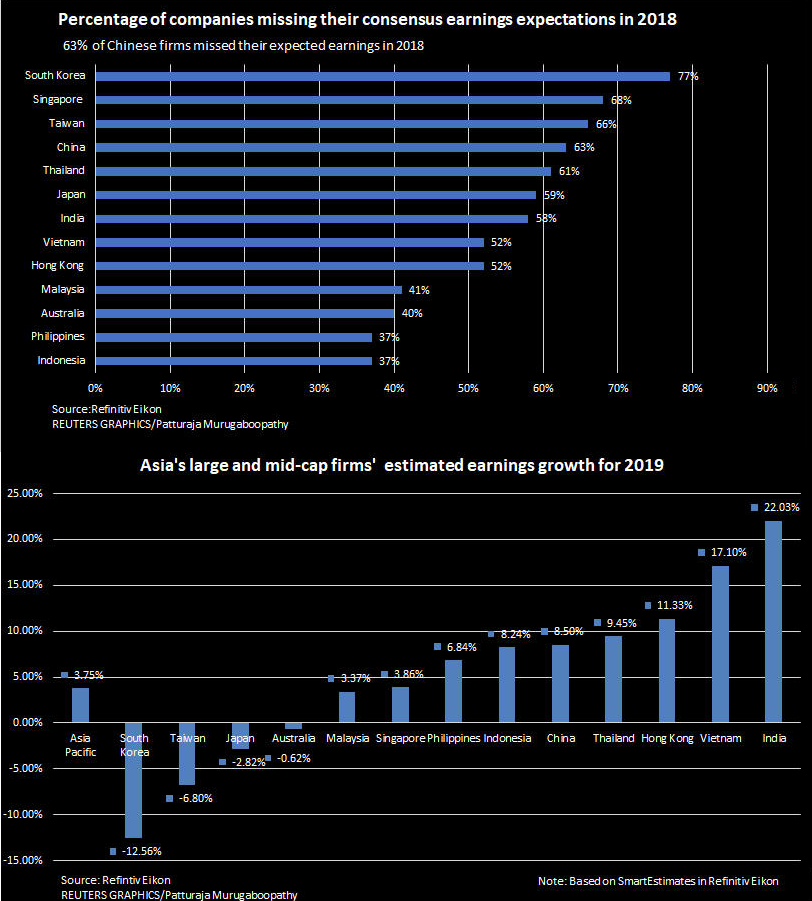
As it can be seen in the second chart, in case of half of countries, companies’ profits are expected to fall or not exceed real inflation. Remember that we are talkng about earnings expectations for this year (they will probably gradually reduced).
In our opinion, it is very positive that China is trying to support the economy by lowering taxes and generally facilitating economic activity. In 2019, plans include VAT cuts for the production, transport and construction sectors amounting to 298 billion dollars.
On the other hand, China has been following U.S. footsteps for a long time and they are trying to artificially sustain good economic environment and keep shares and bond prices. This means that they are trying to influence the economic and market cycles, which should not be disturbed. As a result, debt in China has enormously grown and we are concerned that over time China may not be able to deal with it, which will result in an extreme downturn. Such a situation will strongly affect the whole world because China share in global GDP is significant.
Probably when this happens, Chinese authorities even more likely will manipulate data and in official communications inform that economic data is good, although in reality Chinese economy will shrink. The authorities will be able to take such a step, because in China the recognition of the rulling party can not be undermined. Therefore, the rulers will not admit that they failed during implementation of a long-term vision of state development.
Article by Independent Trader

