

CMG Capital Management: Recession Watch – Keep An Eye On This Chart
April 24, 2015
By Steve Blumenthal
“The most difficult thing is the decision to act, the rest is merely tenacity.”
– Amelia Earhart
Understanding when a recession might begin is important to our long-term financial health. Why? The stock market declines approximately 40% during recessions. I’ve spent a lot of time over the last several weeks looking at various economic forecasts. Frankly, I can make a pretty good argument for either an acceleration or decline.
We look to economists’ forecasts with eager eyes, yet, if you are like me, leave those presentations mostly frustrated. A lot of noise with little conviction to act on. Frankly, often times I feel it is like flipping a coin. Here is an example of what I mean:
”Our analysis shows that economic growth will get worse in the coming months. In contrast, the consensus view on the economy is that things will get even better.” ECRI’s Lakshman Achuthan
The consensus view sees economic improvement ahead while Achuthan sees the economy getting worse. I share a chart today that shows every recession since 1950. The point I’m trying to make is that there have been seven recessions since 1970 and the economists “consensus view” missed them all. Zero for seven is a poor track record on the very topic they focus on most.
I think there is a better way and I was reminded this morning about one of my favorite recession forecasting charts. I share it with you today and will begin including it each week in Trade Signals. For me, it mutes the noise and has a 79% accuracy rate dating back to 1950. Let’s take a look at the chart.
Included in this week’s On My Radar:
- Recession – What to Watch For
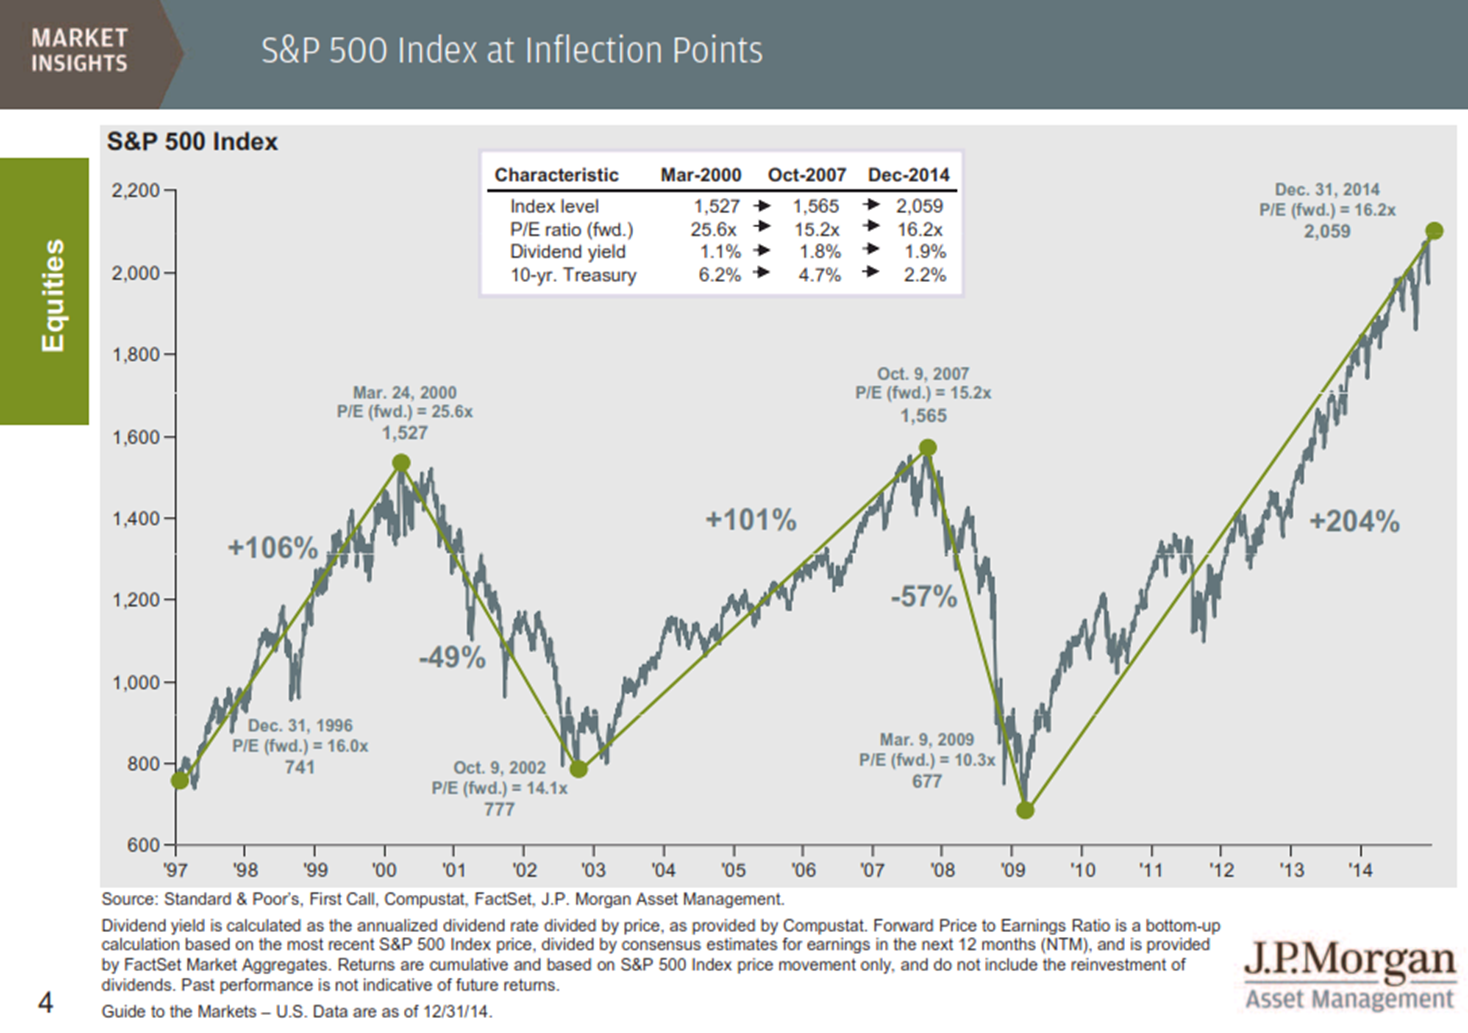
- The S&P 500 Index and Federal Reserve Intervention
- Trade Signals – Trend and Sentiment Remain Bullish, Bond Models Bullish
Recession – Keep an Eye on This Chart
Definition (courtesy of Wikipedia):
In economics, a recession is a business cycle contraction. It is a general slowdown in economic activity. Macroeconomic indicators such as GDP (gross domestic product), investment spending, capacity utilization, household income, business profits, and inflation fall, while bankruptcies and the unemployment rate rise.
Recessions generally occur when there is a widespread drop in spending (an adverse demand shock). This may be triggered by various events, such as a financial crisis, an external trade shock, an adverse supply shock or the bursting of an economic bubble. Governments usually respond to recessions by adopting expansionary macroeconomic policies, such as increasing money supply, increasing government spending and decreasing taxation.
Recessions have averaged approximately 13 months. The stock market declined more than 50% during the last two recessions. The stock market is a leading indicator of recession.
There of several points to note in the following chart. First, the gray areas in the chart mark periods of recession. Second, the down arrows show when the indicator predicted recession and the up arrows when it predicted the end of recession. Third, you can see that there were several head fakes (down arrows that didn’t materialize in recession) but each time the signal quickly corrected.
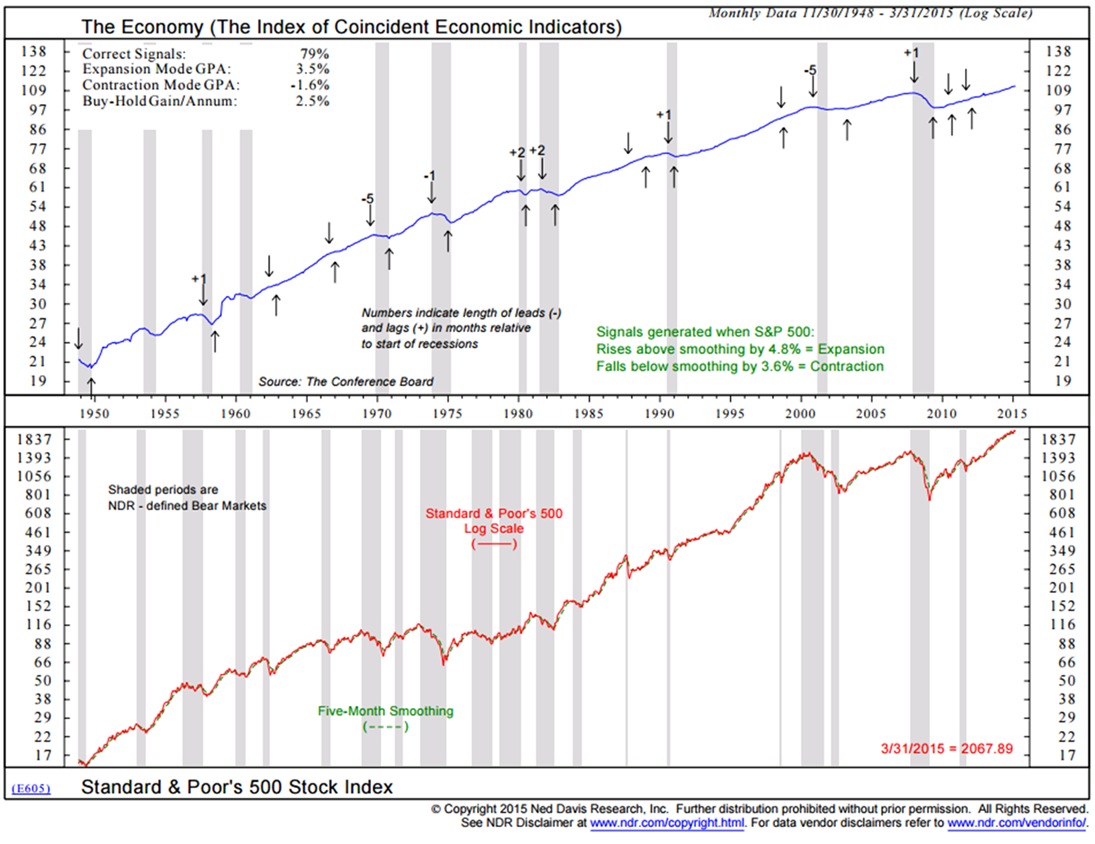
Here is a short summary of how to read the chart (source: NDR):
The chart compares the economy, as represented by the Commerce Department’s Composite Index of Coincident Indicators (top clip), with the monthly closing price of the Standard and Poor’s 500 Stock Index (bottom clip).
The S&P 500 is a capitalization-weighted (price times number of shares outstanding) index of 500 of the largest and best known common stocks. These include industrials, transports, utilities, and financials.
The S&P 500 generates an expansion signal for the economy when it rises above its eight-month smoothing by 2.0%. Conversely, it generates a contraction signal for the economy when it falls below its eight-month smoothing by 4.6%.
Because the stock market is a barometer of investor confidence in future business activity (as well as a source of capital for industry), it tends to be an excellent leading economic indicator. An NDR research study has found that from 1948 to 1991,the S&P 500 has led, on average, economic peaks by eight months and economic troughs by four months.
Given the Fed’s dual mandate to increase inflation and employment, let’s take a look at current inflation and the velocity of money in the next two charts. In short, inflation is not a problem currently and the velocity of money is at a record low.
Inflation is Not Currently a Problem
I circle in yellow the most recent year-over-year changes in PPI and CPI. There is clearly no sign of inflation.

Velocity of Money
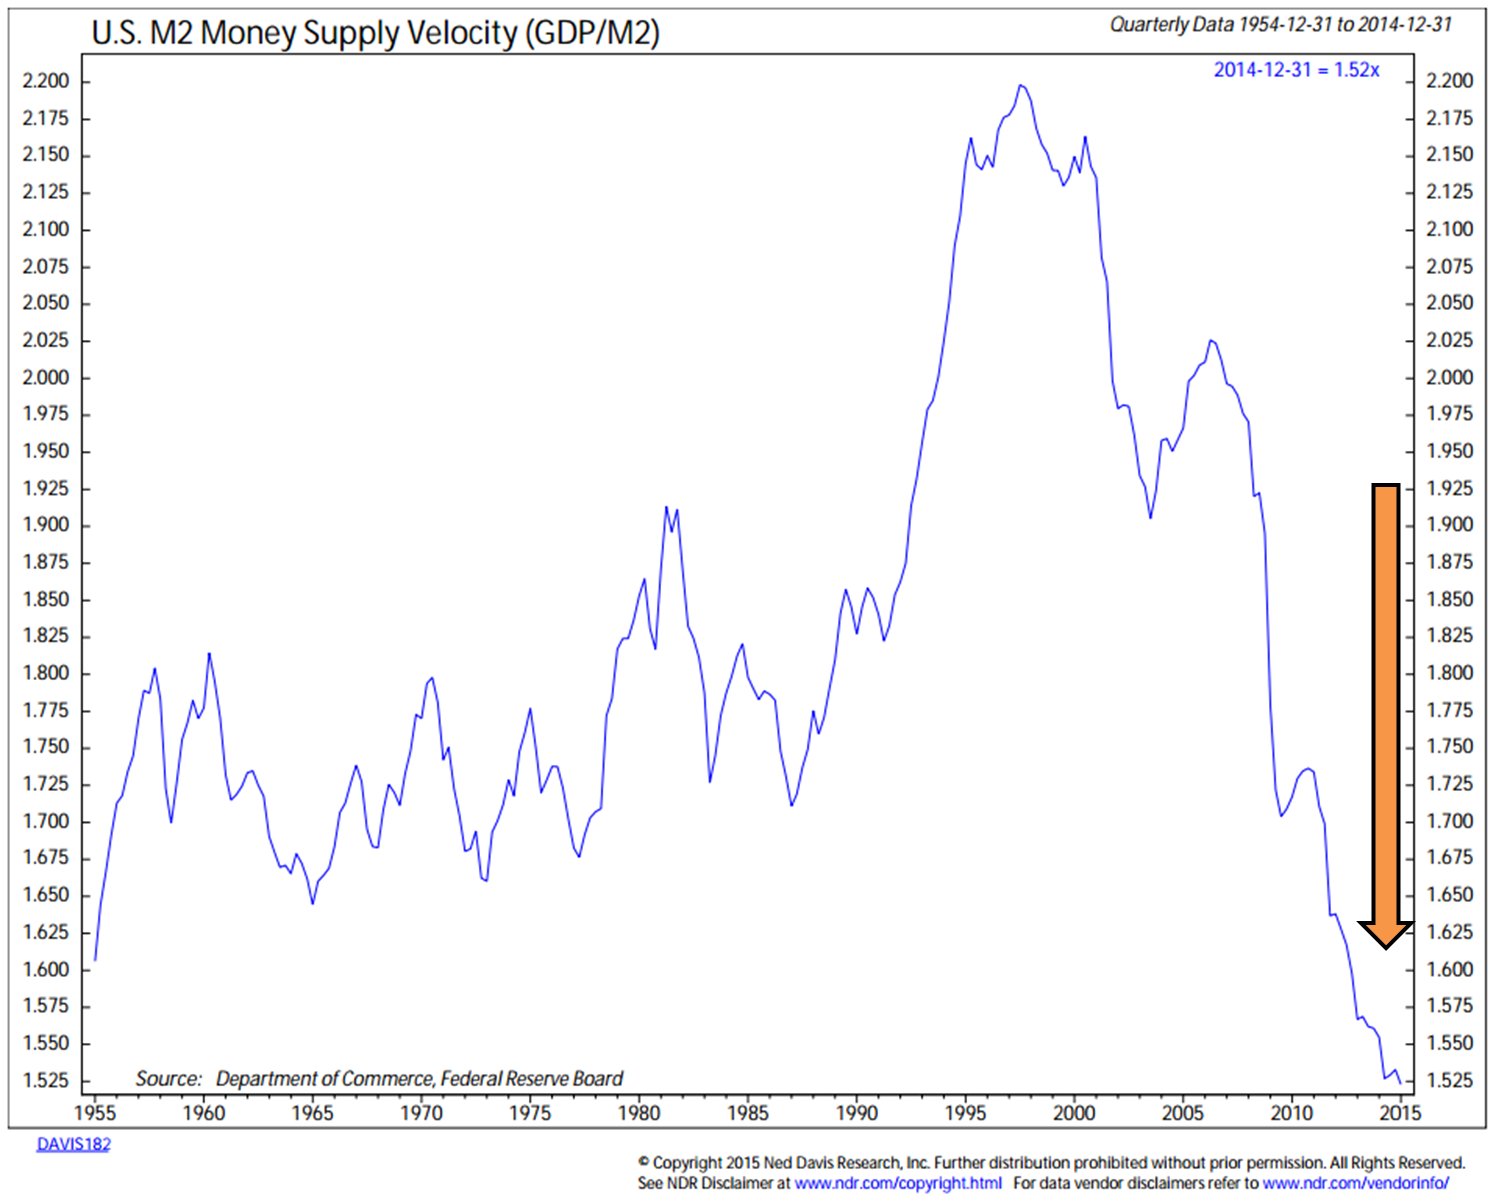
This chart plots money supply velocity for the U.S., calculated as gross domestic product divided by M2 money supply and shows secular trends in velocity since 1954.
“The velocity of money refers to how fast money passes from one holder to the next. If the velocity of money is increasing, then transactions are occurring between individuals more frequently.” Source: Wikipedia.
Despite the massive amount of QE currency creation, amazingly, velocity has fallen off the charts. Because of this (and other reasons) I believe there is a much greater risk of recession.
History of Inflation, 10-Year Treasury Yields and the Federal Funds Rates
I believe it is helpful to step back and look at recent activity through the lens of history. Note in the next chart the history, 1960 to present, of recessions, inflation, the 10-Year Treasury yield (interest yields) and Fed policy (Fed funds rate).
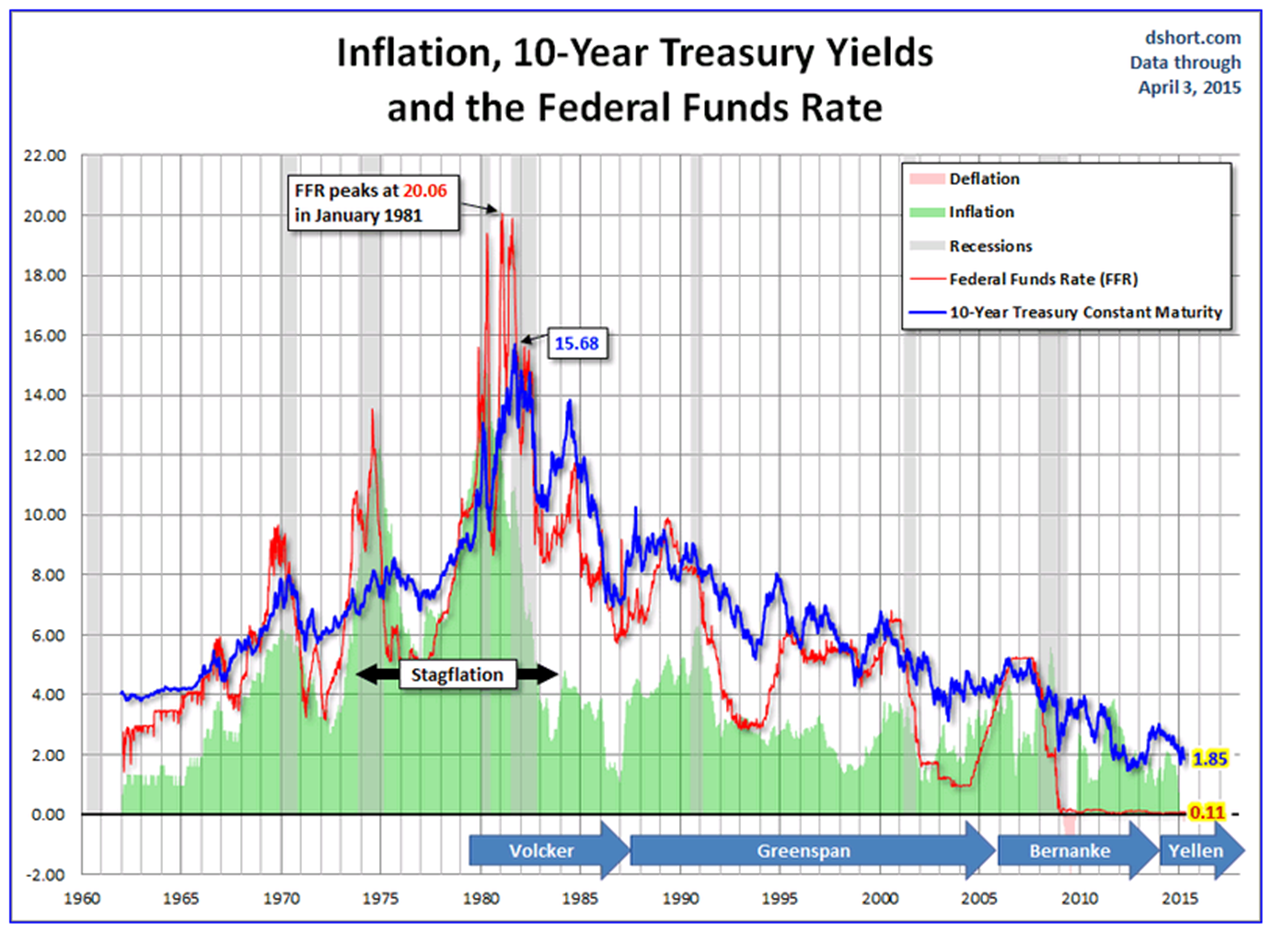
Chart source: Advisor Perspectives
Notice the flat “red” Fed funds rate line at the bottom of the chart reflecting six years of zero interest rate policy. The Fed knows it needs to normalize rates. I particularly like how Doug Short showed the Volvker, Greenspan, Bernanke and Yellen periods.
The 10-Year was at 4% in 1960. Normalized in Fed speak means a 2% Fed funds rate or higher (currently at 0.11%). Today, the 10-Year Treasury yields 1.95%. Which way do we go from here? Perhaps we see 1% before we see 4% (I doubt that, yet some of my smart friends are predicting that outcome); however, to see this as normal and project the recent past into the forever future takes powerful mind altering medication or a mental state of delusion.
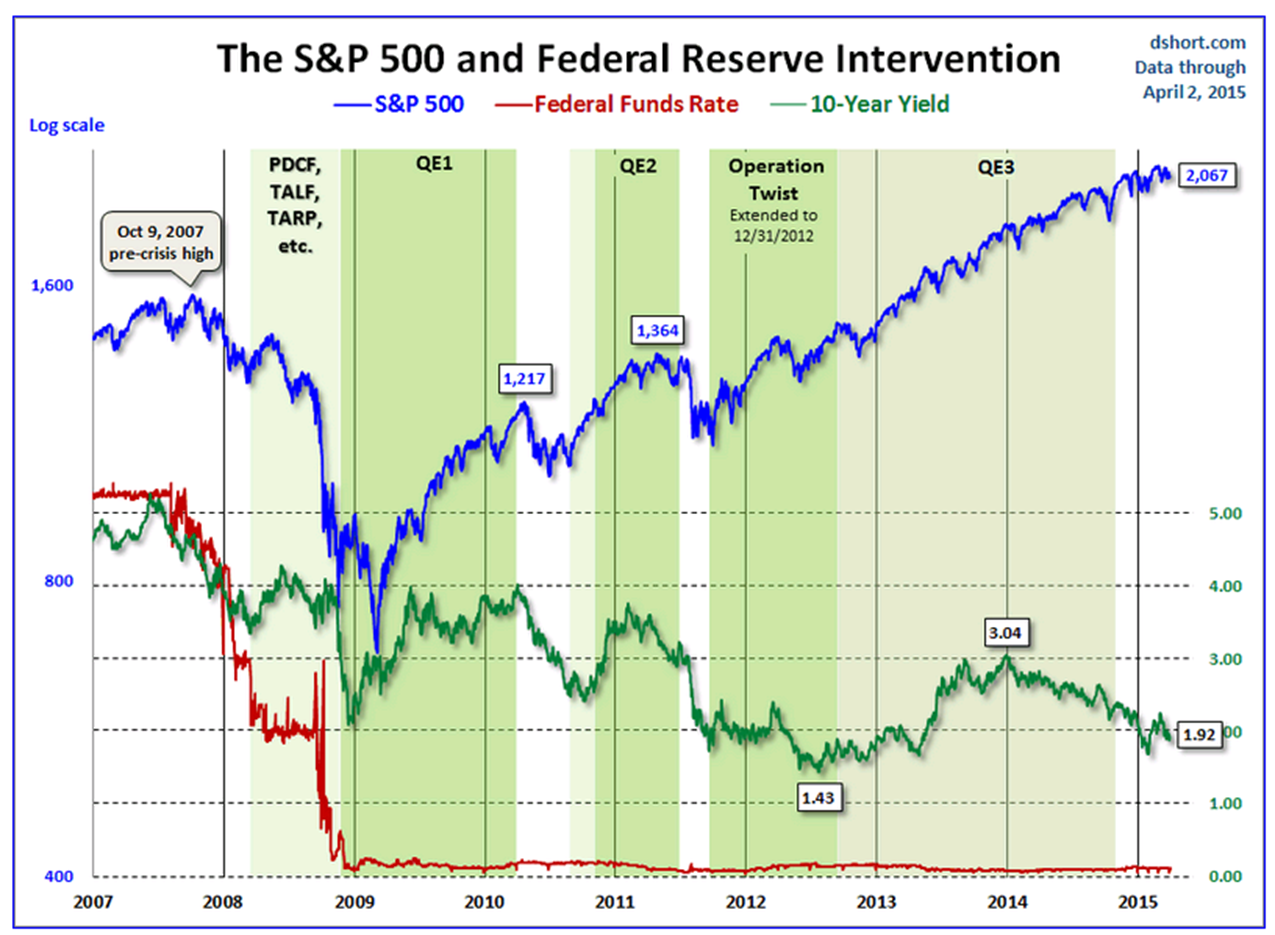
We have witnessed an unprecedented period of Fed intervention and this next chart serves as a reminder. Follow the green 10-Year Yield line in the center of the chart: 5% in 2007, 4% to 2% in 2008, 2% to 4% in 2009… less than 2% today.
Something will happen to reset the risk. In my view, the bubble that beats all bubbles is in the bond market. I believe a sovereign debt default crisis is on the horizon and may just serve to trigger another global financial storm. It won’t be isolated to just Europe or Japan. The effects will be global.
If equity prices were cheaply priced, I’d be less concerned. They are not. See my “High Valuations = Low Forward Returns” or this more recent piece from John Hussman titled, “Margins, Multiples, and the Iron Law of Valuation”. By all reasonable measures, equities are expensively priced yet U.S. equities could go even higher (tied to the attractiveness of the U.S. dollar and recipient of global capital flows).
Finally, it is important to remember that bear markets wipe out more than half of the preceding bull market’s gain. Have a plan in place to risk manage your equity exposure.
Just a few more interesting facts courtesy of Art Cashin (from his letter):
“You Don’t Look A Day Over….. – My good friend and fellow market veteran, Jim Brown over at Option Investor did a little digging on the longevity of market moves. Here’s what he wrote:
The current bull market is 2,184 days old and has gained +213.1%. That is above average in duration and magnitude. There have been 11 bull markets and 10 bear markets since 1949. The prior 10 bull markets lasted an average of 1,770 calendar days and produced gains of +161.4%. Inside those 11 bull markets were 22 corrections from 10% to 19.9% for an average of two corrections per bull market.
With the current bull market almost four years old and the fourth longest on record it is understandable that investors would be getting a little worried with the S&P trading near a forward PE of 18 but with earnings declining. The S&P has now gone 1,292 days without a correction. The long term average between corrections is 514 days. We are due. Data from Jeff Hirsch.”
Trade Signals – “Risk On” Trade Remains in Place
The trend remains positive and sentiment supportive.
Included in this week’s Trade Signals:
- Cyclical Equity Market Trend: The Primary Trend Remains Bullish for Stocks
- Volume Demand Continues to Better Volume Supply: Bullish for Stocks
- Weekly Investor Sentiment Indicator:
- NDR Crowd Sentiment Poll: Neutral Signal from Optimism (short-term Neutral for stocks)
- Daily Trading Sentiment Composite: Neutral Signal from Pessimism (short-term Bullish for stocks)
- The Zweig Bond Model: The Cyclical Trend for Bonds is Bullish
Click here for the full piece.
Personal note
“The most difficult thing is the decision to act, the rest is merely tenacity.” – Amelia Earhart
I have no real rhyme or reason to the Earhart quote except to say – what a great individual she was and I love her advice. I’m thinking some tenacity is ahead this week or at least I best show it – there is way too much work around the house to get done.
Wishing you the very best.
Have a great weekend!
With kind regards,
Steve
Stephen B. Blumenthal
Founder & CEO
CMG Capital Management Group, Inc.
IMPORTANT DISCLOSURE INFORMATION
Please remember that past performance may not be indicative of future results. Different types of investments involve varying degrees of risk. Therefore, it should not be assumed that future performance of any specific investment or investment strategy (including the investments and/or investment strategies recommended and/or undertaken by CMG Capital Management Group, Inc. (or any of its related entities-together “CMG”) will be profitable, equal any historical performance level(s), be suitable for your portfolio or individual situation, or prove successful. No portion of the content should be construed as an offer or solicitation for the purchase or sale of any security. References to specific securities, investment programs or funds are for illustrative purposes only and are not intended to be, and should not be interpreted as recommendations to purchase or sell such securities.
Certain portions of the content may contain a discussion of, and/or provide access to, opinions and/or recommendations of CMG (and those of other investment and non-investment professionals) as of a specific prior date. Due to various factors, including changing market conditions, such discussion may no longer be reflective of current recommendations or opinions. Derivatives and options strategies are not suitable for every investor, may involve a high degree of risk, and may be appropriate investments only for sophisticated investors who are capable of understanding and assuming the risks involved. Moreover, you should not assume that any discussion or information contained herein serves as the receipt of, or as a substitute for, personalized investment advice from CMG or the professional advisors of your choosing. To the extent that a reader has any questions regarding the applicability of any specific issue discussed above to his/her individual situation, he/she is encouraged to consult with the professional advisors of his/her choosing. CMG is neither a law firm nor a certified public accounting firm and no portion of the newsletter content should be construed as legal or accounting advice.
This presentation does not discuss, directly or indirectly, the amount of the profits or losses, realized or unrealized, by any CMG client from any specific funds or securities. Please note: In the event that CMG references performance results for an actual CMG portfolio, the results are reported net of advisory fees and inclusive of dividends. The performance referenced is that as determined and/or provided directly by the referenced funds and/or publishers, have not been independently verified, and do not reflect the performance of any specific CMG client. CMG clients may have experienced materially different performance based upon various factors during the corresponding time periods.
CMG Global Equity FundTM and CMG Tactical Futures Strategy FundTM: Mutual Funds involve risk including possible loss of principal. An investor should consider the Fund’s investment objective, risks, charges, and expenses carefully before investing. This and other information about the CMG Global Equity FundTM and CMG Tactical Futures Strategy FundTM is contained in each Fund’s prospectus, which can be obtained by calling 1-866-CMG-9456. Please read the prospectus carefully before investing. The CMG Global Equity FundTM and CMG Tactical Futures Strategy FundTM are distributed by Northern Lights Distributors, LLC, Member FINRA. NOT FDIC INSURED. MAY LOSE VALUE. NO BANK GUARANTEE.
Hypothetical Presentations: To the extent that any portion of the content reflects hypothetical results that were achieved by means of the retroactive application of a back-tested model, such results have inherent limitations, including: (1) the model results do not reflect the results of actual trading using client assets, but were achieved by means of the retroactive application of the referenced models, certain aspects of which may have been designed with the benefit of hindsight; (2) back-tested performance may not reflect the impact that any material market or economic factors might have had on the adviser’s use of the model if the model had been used during the period to actually mange client assets; and, (3) CMG’s clients may have experienced investment results during the corresponding time periods that were materially different from those portrayed in the model. Please Also Note: Past performance may not be indicative of future results. Therefore, no current or prospective client should assume that future performance will be profitable, or equal to any corresponding historical index. (i.e. S&P 500 Total Return or Dow Jones Wilshire U.S. 5000 Total Market Index) is also disclosed. For example, the S&P 500 Composite Total Return Index (the “S&P”) is a market capitalization-weighted index of 500 widely held stocks often used as a proxy for the stock market. Standard & Poor’s chooses the member companies for the S&P based on market size, liquidity, and industry group representation. Included are the common stocks of industrial, financial, utility, and transportation companies. The historical performance results of the S&P (and those of or all indices) and the model results do not reflect the deduction of transaction and custodial charges, or the deduction of an investment management fee, the incurrence of which would have the effect of decreasing indicated historical performance results. For example, the deduction combined annual advisory and transaction fees of 1.00% over a 10 year period would decrease a 10% gross return to an 8.9% net return. The S&P is not an index into which an investor can directly invest. The historical S&P performance results (and those of all other indices) are provided exclusively for comparison purposes only, so as to provide general comparative information to assist an individual in determining whether the performance of a specific portfolio or model meets, or continues to meet, his/her investment objective(s). A corresponding description of the other comparative indices, are available from CMG upon request. It should not be assumed that any CMG holdings will correspond directly to any such comparative index. The model and indices performance results do not reflect the impact of taxes. CMG portfolios may be more or less volatile than the reflective indices and/or models.
In the event that there has been a change in an individual’s investment objective or financial situation, he/she is encouraged to consult with his/her investment professionals.
Written Disclosure Statement. CMG is an SEC registered investment adviser principally located in King of Prussia, PA. Stephen B. Blumenthal is CMG’s founder and CEO. Please note: The above views are those of CMG and its CEO, Stephen Blumenthal, and do not reflect those of any sub-advisor that CMG may engage to manage any CMG strategy. A copy of CMG’s current written disclosure statement discussing advisory services and fees is available upon request or via CMG’s internet web site at (http://www.cmgwealth.com/disclosures/advs).

