
A lot is going on in markets right now with regards to commodities, emerging markets, and in particular – the US dollar. The moves of the next few weeks have the possibility to shape the prevailing trend of the markets for the next few months if not years, so it’s really important to get clarity on these key issues in my view.
Q1 hedge fund letters, conference, scoops etc
Today’s chart comes from a report on the outlook for commodities and EMFX, which also discussed the attempted breakout of the US dollar index.
The chart shows the GSCI Commodities Index and a set of competing trend lines.
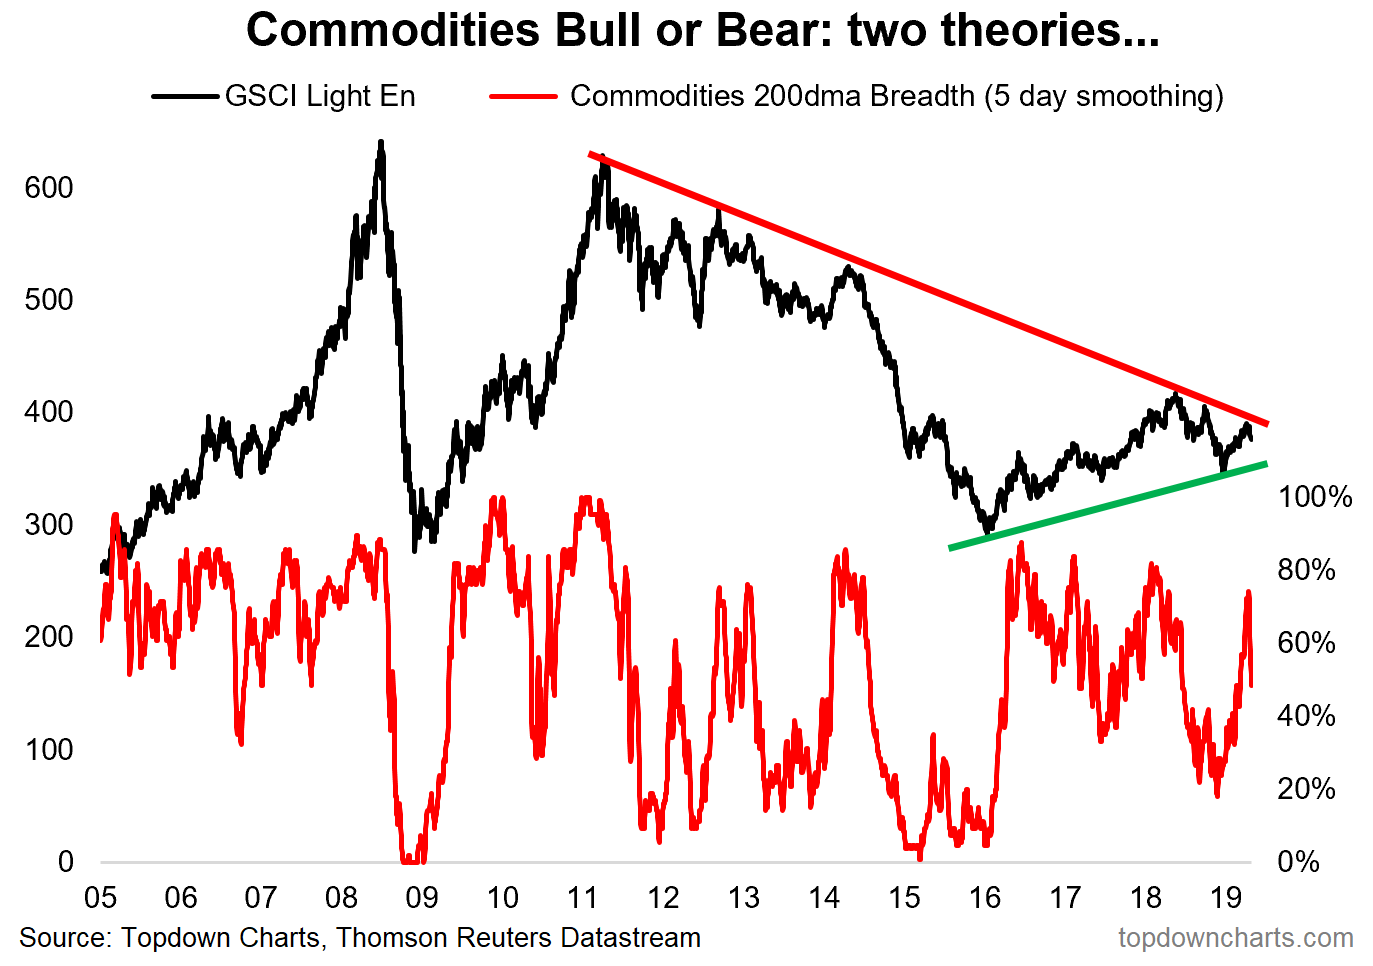
First of all, I use the GSCI Light Energy index because it offers a more diversified view of commodities than the classic GSCI (which has a heavy weighting to energy). This index is what many asset allocators use when thinking about commodities in an aggregate or asset class view.
But straight to the point, the key issue for commodities is the question of “is it a bear or bull market?” In this case I think we’re ultimately going to need to defer to price to tell us one way or the other, and the two trend lines in the chart basically present the case for two competing theories: 1. commodities are still in a bear market; or 2. commodities are in the early stages of a new bull market.
The new bull market theory gets proven basically when/if the index breaks out above the downtrend (red) line). The bear market continuation theory basically gets proven if prices break back down below that nascent uptrend (green) line.
I added breadth in as well because I discussed that quite a bit in the original report, but also because it provides a little bit of extra context and a cautionary given what’s unfolding at this minute.
Commodities 200-day moving average breadth (of the components of the GSCI) is rolling over, and there also seems to be a downtrend in this indicator (and hence another test to pass for the new bull market thesis). With the attempted breakout of the US dollar, still patchy global economic data, and renewed geopolitical concerns of the past couple of days (China trade war, Iran/Middle East, North Korea), it certainly presents at least a short-term challenge to the new bull market theory.
But as much as I like to bring in the fundamental and macro views, sometimes you just have to listen to what price is telling you – price moves faster than fundamentals, and price more often than not shapes the “narratives” and not the other way round, so keep an eye on this chart as commodities come to a crossroads.
—
This article originally appeared as a submission at See It Market
Article by Top Down Charts

