
This is the penultimate in a 10-part blog series where I will go through each of the charts from the 10 Charts to Watch in 2019. The purpose is to add some extra comments and context around the charts, as well as to explain some of the finer details of the indicators.
Q4 hedge fund letters, conference, scoops etc
In this report we look at a unique asset class; diversified commodities (in this case using the GSCI Light Energy Index). As the chart says and shows – and as with the title of this blog – commodities are cheap and out of favor.
Before we get into the indicators and facts which lead us to this assertion, first check out the chart and also notice the previous instances where both indicators were stretched negative.
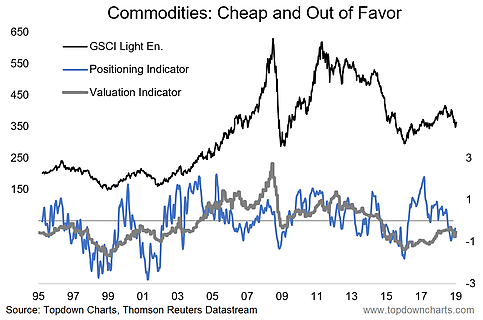
Importantly, let’s look at what these lines are. First, the black line is the GSCI Light Energy Index (a more diversified version of the energy-heavy GSCI). Second, the grey line is a composite valuation indicator based on a few different factors (mostly our secret sauce – might share with clients). Third is an aggregated commodity futures positioning indicator based on the CFTC Commitment of traders report (designed to reveal investor sentiment on commodities).
Note: on that last point, the government shutdown has impacted the CFTC and the last CoT report was in late December, so strictly speaking the chart is slightly out of date. As Trump has just signed a continuing resolution to temporarily open up the government again, the data should soon be available and I will tweet the updated chart out in due course.
Now back into commodities, and back into what should we be thinking about here’s the original line from the 2018 End of Year Special report:
“Beset by numerous headwinds and cross-currents last year, commodities ended 2018 looking un-loved and undervalued. …there’s always room to go lower, but as long as the global economy avoids recession and if China/EM do ultimately stabilize and improve the case for commodities starts to look very good. And it’s often that you see commodities tend to do well later in the cycle. As the window starts to close for US dollar strength, that could be the final element to fall into place for commodities (and EM).”
Basically a lot went wrong for commodities in 2018, and now some of those headwinds look set to fade. As I talked about in the latest weekly macro themes report, the technicals for commodities are starting to look very interesting and a key juncture lies ahead which will determine whether commodities are in a new bull market or are simply continuing a multi-year bear market.
So for those with the latitude to allocate to commodities, keep an eye on this sometimes forgotten sector, because things could get interesting…
For more and deeper insights on global economics and asset allocation, and plenty of good charts you may want to subscribe to our institutional research service.
Click through for free look or a trial…
Article by Top Down Charts

