
Check out this week’s Danger Zone interview with Chuck Jaffe of Money Life.
Q3 hedge fund letters, conference, scoops etc
We often talk about the importance of holdings analysis when it comes to ETF and mutual fund research. After all, the performance of the holdings equals the performance of the ETF/mutual fund. However, holdings are just one of the drivers of future fund performance. Investors also need to pay attention to costs when picking a fund.
Unfortunately, stated fund expense ratios don’t give investors the entire picture of what a fund costs. To provide a clearer picture, we developed our proprietary total annual costs (TAC) metric, which incorporates the expense ratio, front end load, back-end load, redemption fee, transaction costs, and opportunity costs. In other words, total annual costs give investors as accurate a measure as possible of the costs of being in any given fund.
This week, we’re putting five of the most expensive mutual funds under coverage in the Danger Zone. Even if they had high-quality holdings (which they don’t), one can’t expect these funds to outperform due to their excessive fees.
Get the best fundamental research
Five Funds That Gouge Investors
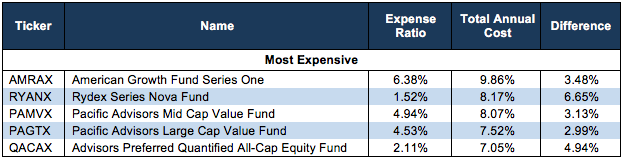
The five funds in Figure 1, American Growth Fund Series One (AMRAX), Rydex Series Nova Fund (RYANX), Pacific Advisors Mid Cap Value Fund (PAMVX), Pacific Advisors Large Cap Value Fund (PAGTX), and Advisors Preferred Quantified All-Cap Equity Fund (QACAX) have an average TAC of 8.14%. For comparison, the average TAC of all 7,200+ mutual funds under coverage is 1.77% while the asset weighted average is lower at 1.06%.
As shown in Figure 1, these funds’ expense ratios significantly understate the true costs to investors. In some cases, the TAC is more than five times higher than the stated expense ratio.
Figure 1: 5 Most Expensive Mutual Funds*
* Mutual funds exclude multiple shares of the same fund
Sources: New Constructs, LLC and company filings
Below, we analyze each of these five funds and quantify just what their high TACs mean for investors.
American Growth Fund Series One (AMRAX)
AMRAX is managed using a “growth style of investing” and invests primarily in large cap common stocks and securities convertible into common stock. No matter how successful this process is, AMRAX’s 9.86% TAC earns it the dubious title of “most expensive mutual fund under coverage.” AMRAX’s TAC breaks down as follows:
- Front-End Load – 2.19%
- Expense Ratio – 7.65%
- Back-End Load – 0.00%
- Redemption Fee – 0.00%
- Transaction Costs – 0.03%
To justify its higher total annual costs, AMRAX must outperform its ETF benchmark, the iShares Russell 3000 ETF (IWV) before all costs by 9.6% annually over 3 years or 8.0% annually over 10 years. AMRAX’s transaction costs are estimated using the fund’s annual portfolio turnover ratio of 11%. We can also quantify how much AMRAX’s TAC will cost over multiple holding periods. AMRAX’s 3-year accumulated total costs are $3,016 and just $80 for IWV. 10-year accumulated total costs are $13,293 for AMRAX and $514 for IWV.
The only justification for a mutual fund to charge higher fees than its ETF benchmark is “active” management that leads to out-performance. A fund is most likely to outperform if it has higher quality holdings than its benchmark. Leveraging our Robo-Analyst technology[1], we analyze the holdings of all ETFs and mutual funds under coverage. Through this analysis we find that AMRAX’s asset allocation looks more like closet indexing than active management. AMRAX allocates 34% of its value to Unattractive-or-worse rated stocks (IWV is 33%) and 22% to Attractive-or-better rated stocks (IWV is 23%). With little difference in asset allocation, investors can’t expect significant outperformance vs. the benchmark, yet are paying significantly higher fees. For comparison, IWV charges TAC of just 0.22%.
Rydex Series Nova Fund (RYANX)
RYANX is managed as a leveraged equity mutual fund and seeks to provide results that match 150% of the performance of the S&P 500 on a daily basis. RYANX’s stated expense ratio of 1.52% significantly understates (by over five times) the true costs of investing in this fund. RYANX’s TAC breaks down as follows:
- Front-End Load – 1.80%
- Expense Ratio – 1.73%
- Back-End Load – 0.00%
- Redemption Fee – 0.00%
- Transaction Costs – 4.64%
It’s important to note how much “active management” costs investors in RYANX. The fund’s transaction costs of 4.64% are estimated using the fund’s annual portfolio turnover ratio of 2067%. These costs are taken directly from shareholder assets, as they’re charged on the daily movement in/out of securities. To justify its higher total annual costs, RYANX must outperform its ETF benchmark, the iShares Russell 3000 ETF (IWV), before all costs by 7.9% annually over 3 years or 6.6% annually over 10 years. 3-year accumulated total costs are $1,202 for RYANX and $80 for IWV while 10-year accumulated total costs are $4,741 for RYANX and $514 for IWV.
Similar to AMRAX above, investors in RYANX are paying much higher fees without receiving greater asset allocation. While the strategy employed is different than simply indexing, the makeup of RYANX’s portfolio is very similar compared to its benchmark. RYANX allocates 25% of its value to Unattractive-or-worse rated stocks (IWV is 33%) and 21% of its value to Attractive-or-better rated stocks (IWV is 23%). Investors are taking on significant risk using a leveraged strategy when they could get similar portfolio allocation (and much lower fees) from the benchmark.
Pacific Advisors Mid Cap Value Fund (PAMVX)
PAMVX is managed using a “value-based investment approach focusing on the long-term market cycle” and invests at least 80% of assets in mid cap companies. Last quarter, the no mid cap style ranked higher than seventh in our Style Ratings for ETFs and Mutual Funds report. PAMVX’s TAC breaks down as follows:
- Front-End Load – 2.19%
- Expense Ratio – 5.83%
- Back-End Load – 0.00%
- Redemption Fee – 0.00%
- Transaction Costs – 0.05%
Unlike RYANX, investors in PAMVX don’t pay significant transaction costs as the fund’s annual portfolio turnover ratio is just 9%. However, investors are charged a large expense ratio each year. To justify its higher total annual costs, PAMVX must outperform its ETF benchmark, the iShares Russell Mid-Cap ETF (IWR) before all costs by 7.8% annually over 3 years or 6.2% annually over 10 years. 3-year accumulated total costs are $2,534 for PAMVX and $80 for IWR. 10-year accumulated total costs are $11,208 for PAMVX and $514 for IWR.
Compounding the high fees, PAMVX’s holdings are actually slightly worse than its benchmark. Its managers allocate less to high quality stocks and more to low quality stocks. PAMVX allocates 45% of its value to Unattractive-or-worse rated stocks (IWR is 43%) and 15% of its value to Attractive-or-better rated stocks (IWR is 16%).
A look at the top 10 holdings reveals that seven receive an Unattractive-or-worse rating and comprise 32% of its total portfolio. One such stock, Genesee & Wyoming (GWR: $83/share) receives a Very Unattractive rating due to its poor fundamentals and the lofty expectations baked into its stock price.
Since 2013, GWR has grown revenue by 9% compounded annually while after-tax profit (NOPAT) has fallen by 1% compounded annually. GWR’s NOPAT margin fell from 19% in 2013 to 13% over the trailing twelve months (TTM) while its return on invested capital (ROIC) fell from 6% to 4% over the same time. Economic earnings, which take into account cost of capital and changes to the balance sheet, fell from -$60 million in 2013 to -$293 million TTM and have been negative every year since 2000.
Despite the declining fundamentals, the stock remains priced for significant future profit growth. To justify its current price of $83/share, GWR must maintain TTM margins (13%) and grow NOPAT by 12% compounded annually for the next 10 years. See the math behind this dynamic DCF scenario.
Even if GWR can maintain TTM margins and grow NOPAT by 6% compounded annually (double the freight industry average over the past five years) for the next decade, the stock is worth just $31/share today – a 63% downside. See the math behind this dynamic DCF scenario.
Not only do PAMVX investors pay fees that dwarf the benchmark (IWR’s TAC is 0.22%), they’re paying to allocate to stocks with poor fundamentals and overvalued stock prices, such as GWR. This combination is not a winning strategy.
Pacific Advisors Large Cap Value Fund (PAGTX)
PAGTX is managed using a “value-based investment approach focusing on the long-term market cycle” and invests at least 80% of assets in large cap companies. PAGTX’s expense ratio understates its TAC by the least amount of the funds in Figure 1, but even so, the difference between the two is almost 300 basis points. PAGTX’s TAC breaks down as follows:
- Front-End Load – 2.19%
- Expense Ratio – 5.32%
- Back-End Load – 0.00%
- Redemption Fee – 0.00%
- Transaction Costs – 0.00%
To justify its higher total annual costs, PAGTX must outperform its ETF benchmark, the State Street SPDR S&P 500 ETF (SPY) before all costs by 7.4% annually over 3 years or 5.8% annually over 10 years. The 3-year accumulated total costs are $2,394 for PAGTX and $38 for SPY. The 10-year accumulated total costs are $10,560 for PAGTX and $245 for SPY.
Unlike the funds above, PAGTX actually succeeds at finding higher quality stocks than its benchmark. PAGTX allocates only 22% of its value to Unattractive-or-worse rated stocks (SPY is 31%) and 34% of its value to Attractive-or-better rated stocks (SPY is 25%). However, with such high fees (7.52% TAC compared to SPY’s TAC of 0.10%) outperformance is significantly harder to achieve. As noted above, the fund must outperform by more than 7% over three years simply to justify its fees. The high fees create a hurdle that even the best portfolio allocation would have a tough time getting over.
Advisors Preferred Quantified All Cap Equity Fund (QACAX)
QACAX is managed using the type of “black box” algorithm we’ve been critical of in the past. The fund’s subadvisor “analyzes the overall investment opportunities, evaluates and ranks the short-term to intermediate performance, and invests in those securities that best fit the percentage allocations deemed beneficial by the subadvisors multiple proprietary algorithms.” Unfortunately, it looks as if those proprietary algorithms are very costly but don’t provide greater asset allocation, as we’ll show below. QACAX’s TAC breaks down as follows:
- Front-End Load – 0.00%
- Expense Ratio – 2.37%
- Back-End Load – 0.00%
- Redemption Fee – 0.00%
- Transaction Costs – 4.68%
Similar to RYANX, QACAX incurs significant transaction costs due to its annual portfolio turnover ratio of 942%. To justify its higher total annual costs, QACAX must outperform its ETF benchmark, the iShares Russell Mid-Cap ETF (IWR) before all costs by 6.8% annually over 3 years or 6.8% annually over 10 years. The 3-year accumulated total costs are $825 for QACAX and $80 for IWR while the 10-year accumulated total costs are $4,981 for QACAX and $514 for IWR.
When analyzing its holdings, we find that QACAX’s black box algorithms find less Unattractive-or-worse rated stocks, but also less Attractive-or-better rated stocks when compared to the benchmark. For instance, QACAX allocates 38% of its value to Unattractive-or-worse rated stocks (IWR is 43%) but just 13% of its value to Attractive-or-better rated stocks (IWR is 16%). While the lower allocation to Unattractive stocks can limit downside risk, the lower allocation to Attractive stocks limits upside potential. Add in QACAX’s 7.05% TAC and outperformance looks unlikely.
What Investors Miss by Not Using Total Annual Costs
As shown in Figure 1, expense ratios can drastically understate the true costs of a fund. Below are each of the items included in TAC, many of which, investors may be unaware of.
- Expense Ratio: Funds disclose multiple expense ratios within their prospectuses, quarterly report and annual reports. We use the net prospectus expense because it is forward-looking, comparable across all funds and represents the expense ratio investors expect to pay when purchasing the fund.
- Front-end Load: Fee paid to the selling broker when shares of the mutual fund are purchased. This load decreases the initial investment.
- Back-end Load: Fee paid directly to the brokers when shares of the mutual fund are sold. This fee is calculated by multiplying the back-end load ratio by the initial investment, ending investment, or the lesser of the two. For the purposes of our calculation we assume that back-end loads are always calculated using the initial investment. Since we assume a 3-year holding period, our Total Annual Cost metric uses the 3-year back-end load ratio.
- Redemption Fee: Similar to a back-end load except that a redemption fee is typically used to defray fund costs associated with the shareholder’s redemptions and is paid directly to the fund. For the purposes of our calculation we treat redemption fees the same as back-end loads. Most redemption fees expire in less than one-year and since we assume a 3-yr holding period, redemption fees impact very few mutual funds.
- Transaction Costs: Costs incurred by a fund as it buys and sells securities throughout the year. Transactions costs are not incorporated in a fund’s expense ratio but rather are taken directly out of shareholder assets. Transaction costs are difficult to calculate and are not included in the prospectus or the annual reports. We calculate transaction costs by multiplying the portfolio turnover by a proprietary transaction cost multiplier.
- Opportunity Costs: The difference in return between a chosen investment and one that is necessarily passed up. Each of the five costs described above have associated opportunity costs because they reduce the amount of money an investor puts to work in a fund.
This article originally published on October 16, 2018.
Disclosure: David Trainer, Kyle Guske II, and Sam McBride receive no compensation to write about any specific stock, style, or theme.
Follow us on Twitter, Facebook, LinkedIn, and StockTwits for real-time alerts on all our research.
[1] Harvard Business School features the powerful impact of our research automation technology in the case New Constructs: Disrupting Fundamental Analysis with Robo-Analysts.
Article by New Constructs

