
One of my favorite global economic data sets to track is the CPB Global Trade Monitor. It’s a relatively timely snapshot of global trade trends, and importantly has an emphasis on volumes. It’s a good data set for picking up on important global trends, for example back in 2015 it helped flag the issues in EM that would ultimately spillover across global markets.
Q4 hedge fund letters, conference, scoops etc
Anyway, enough context. Point of this brief update is to highlight the below chart of import volumes for emerging economies, which shows a rather precipitous decline in December.
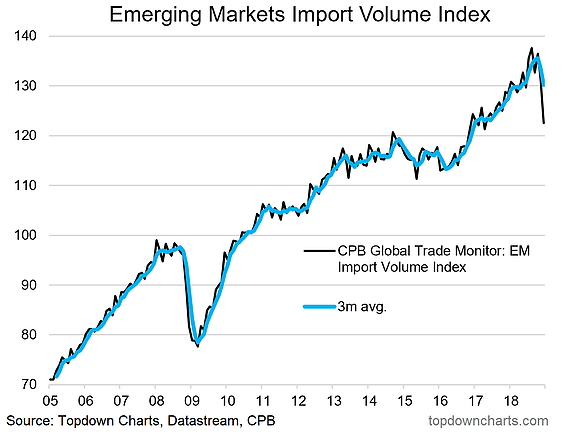
Frankly, I almost find it hard to believe – usually when I see a move this stark my BS detector lights up like a Christmas tree, because there could be an issue with the data… I’ll leave you with that caveat as I go away to dig through the data and my various other source to confirm/deny.
Needless to say if this data is correct (and also not just a one-off blip) then it paints a bleak picture.
Yet, in this sometimes somewhat upside down world, perhaps such a run of data could actually be good for markets because it will most certainly elicit a swift and forceful monetary policy response.
Indeed, it reminds me of the number 10 chart in this article (global monetary policy map) – which, by the way, has since changed notably as a global policy pivot progresses…
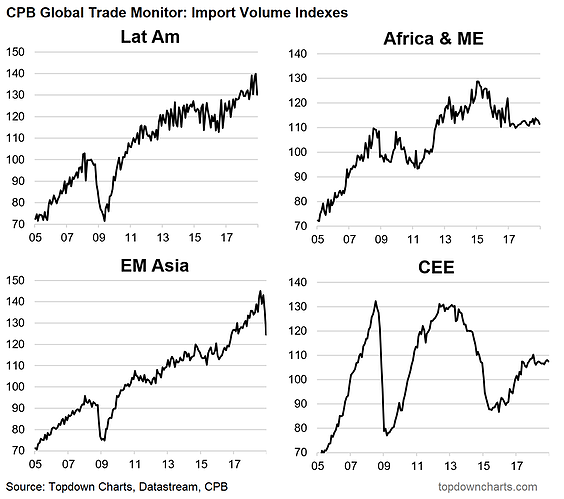
Bonus Chart: One question people should be asking is which part of EM is responsible for this??
This panel of charts show the regional breakdown that CPB provides (this is as granular as it goes)… clearly Emerging Asia is the main culprit.
Article by Top Down Charts

