
This week I took a long hard look at the survey results and a series of other charts, because they all seemed to be challenging my medium term views and biases. Not only that, they seem to be flying in the face of a range of crowded and consensus trades. In short, the bond selloff is being called into question, and if you have questions on bonds, then you’re probably going to end up with questions on the whole reflation trade…
Q1 hedge fund letters, conference, scoops etc, Also read Lear Capital: Financial Products You Should Avoid?
This series of articles looks at the results from the weekly surveys I run on Twitter which ask respondents to differentiate bullish vs bearish views on bonds and equities for fundamental vs technical rationale. I also add some of my other charts and indicators to round out the picture.
The key takeaways from the weekly sentiment snapshot are:
-Equity investors are reassessing the fundamentals outlook.
-Bond investors seem to be already well ahead of them on that front.
-Bond survey trends point to a counter-trend move in bond yields, and the macro momentum seems to line up.
-Questions on bonds may lead to questions on the reflation trade.
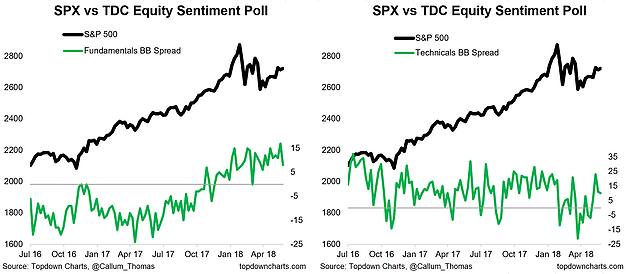
- Equity Fundamentals vs Technicals: Starting as usual with a look at the weekly survey results for equity “fundamentals” vs “technicals” sentiment (the survey asks respondents whether they are bullish or bearish for primarily fundamental vs technical rationale), technical net-bulls dropped slightly, but it was the drop in fundamental net-bulls that caught my attention this week. You could say that based on the latest results investors are starting to reassess the fundamentals outlook. As I noted in the latest weekly S&P500 #ChartStorm, the fundamentals (at least earnings) have been looking pretty decent, but the outlook is by no means baked in.
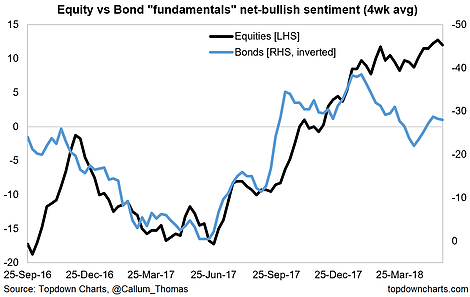
- Bond market vs Equity market Fundamentals: If equity investors are starting to reassess the fundamentals, bond investors might have some hints for them to take note of. This chart – a running feature – shows a divergence in views on the fundamental outlook between bond vs equity investors. In all fairness there can be key fundamental drivers that have major difference in influence on bond vs equity markets… for instance, most of the time better macro data is positive for equities and negative for bonds, but if the positive macro data results in tighter monetary policy that logic can break down or even flip.
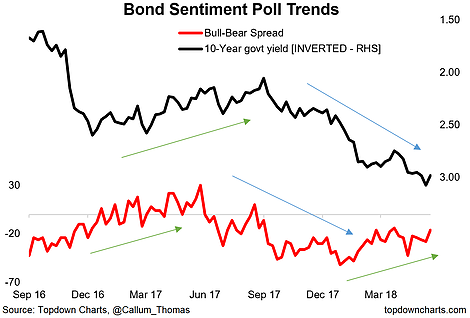
- A Subtle Shift in Sentiment on Bonds: Looking at overall net-bulls for the bond survey, there is an interesting picture emerging as the survey history grows… (the bond survey was only launched back in September 2016). It seems as though changes in the trend of bond market net-bullish sentiment can provide some insight into the direction of bond yields. So it’s interesting then to see the net-bulls line trending subtly higher (becoming slightly less bearish) over the past couple of months. It could be presaging a period of at least consolidation and tighter ranging in yields, if not a move higher, in contrast to the increasingly consensus notion that bond yields head higher (which I will acknowledge has been my medium-term base case since 2016).
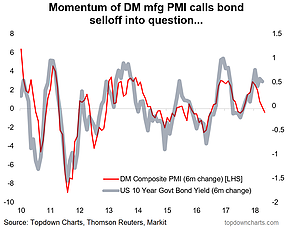
- Bonds vs Macro Momentum: Since we’re talking bond tactics, I thought I would share a chart from the latest edition of the Weekly Macro Themes report (talking about ‘growth wobbles’). The chart shows the rate of change in the Developed Markets composite manufacturing PMI and the US 10-year bond yield. Basically that chart is just sitting there calling out the bond bears. If you take it literally, US 10-year bond yields could make a counter trend move back toward 2.5%. To balance that view though, much of the weakness in the DM PMI is being driven by Europe and Japan… whereas the US is still going strong (and the Fed is getting on with QT and rate hikes). So it is plausible that the correlation breaks, but for now the gap is clear.
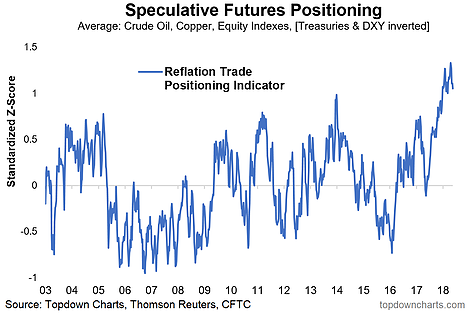
- Reflation Trade at Risk: Going back to the reflation trade speculative futures positioning indicator I introduced a couple of weeks ago, it has since then rolled over from the extreme crowded net-longs. As a reminder it takes the average z-score of standardized net speculative positioning in Crude Oil, Copper, Aggregate US Equity Indexes, and Treasuries & DXY – both inverted (to align the signal). Basically I wanted to include this one because if you’re questioning the selloff in bonds you might as well be questioning the whole reflation trade. And if serious questions get raised then guess what, there’s a whole bunch of traders on one side of the boat who are going to get caught wrong-footed, and we all know how those situations usually end…
Did you know we offer institutional research? Why not take a free trial for an extra level of insight and service…
Follow us on:
LinkedIn https://www.linkedin.com/company/topdown-charts
Twitter http://www.twitter.com/topdowncharts
Article by Callum Thomas, Top Down Charts

