
ETFGI reports ETFs and ETPs listed globally gather net inflows of US$76.24 billion during December 2018, 2nd Highest on record
Q3 hedge fund letters, conference, scoops etc
LONDON — January 10, 2018 — ETFGI, a leading independent research and consultancy firm covering trends in the global ETF/ETP ecosystem, reported today that ETFs and ETPs listed globally gathered net inflows of US$76.24 Bn during December. Despite the turmoil witnessed in developed markets during December, ETFs and ETPs listed globally attracted the 2nd highest net inflow on record, rivalled only by January 2018, which saw inflows of US$105.70 Bn. Total Assets invested in the global ETF and ETP industry fell 5.28% by the end of December, from US$5.06 Tn at the end of November, to US$4.79 Tn, according to ETFGI’s December 2018 Global ETF and ETP industry landscape insights report, an annual paid-for research subscription service. (All dollar values in USD unless otherwise noted, current figures are based on preliminary data)
Highlights
- Net new assets gathered by ETFs/ETPs listed globally were $76.24 Bn in December, 2nd highest on record.
- During 2018, ETFs/ETPs listed Globally attracted $516 Bn in net inflows, less than the $654 Bn gathered in 2017.
- 59th consecutive months of net inflows into ETFs/ETPs listed globally.
“The end of 2018 saw the trend in developed markets reverse, and although arguably predictable, the severity left many pundits scratching their heads. This end of year stress has widely been attributed to the disruption caused by trade disputes feeding into economic data, and the view policy makers are not going to be quite as accommodating as initially expected. The S&P 500 returned -9.03% during December, and down -4.38% for 2018. Developed markets ex-US fell -4.62% during December, led by Japan and Canada, bringing the yearly return to -13.21%. Relatively speaking, EM and FM faired the month better, returning -2.68% and -3.15%, finishing 2018 -13.53% and -11.82%, respectively” according to Deborah Fuhr, managing partner and founder of ETFGI.
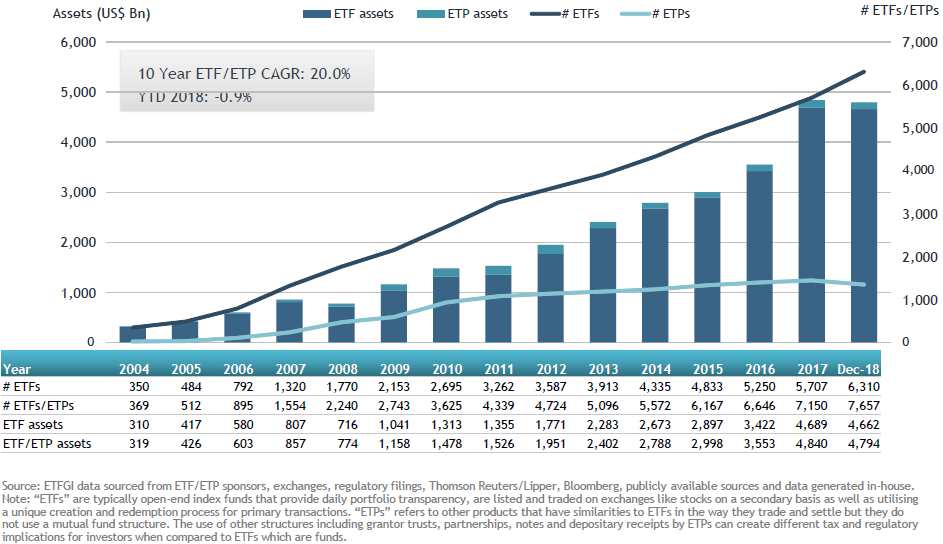
Throughout 2018, the global ETF/ETP industry has continued to grow. January 2018 saw the largest monthly inflow into ETFs/ETPs on record, pushing assets above $5 Tn for the first time. The record for assets invested in ETFs/ETPs was set in September 2018 at $5.26 Tn, marking an 8.6% increase over 2017. However, with most major indices finishing the year in the red, assets invested in the global ETF/ETP industry finished 2018 down, albeit only 0.6%, supported by consistent positive inflows.
At the end of December 2018, the Global ETF/ETP industry had 7,657 ETFs/ETPs, with 14,993 listings, assets of $4.79 Tn, from 401 providers listed on 71 exchanges in 57 countries. Following net inflows of $76.24 Bn and market moves during the month, assets invested in ETFs/ETPs listed globally decreased by 5.28%, from $5.06 Tn at the end of November 2018, to $4.79 Tn.
Growth in Global ETF and ETP assets as of the end of December 2018
Equity ETFs/ETPs listed globally attracted net inflows of $50.87 Bn in December, growing net inflows for 2018 to $362 Bn, less than the $471 Bn in net inflows seen by equity-based products during 2017. Fixed Income ETFs and ETPs listed globally saw net inflows of $21.17 Bn in December, bringing net inflows for 2018 to $107 Bn, less than the $142 Bn seen during 2017.
December marked the 59th consecutive month of net inflows into ETFs/ETPs listed globally, for 2018 ETFs/ETPs listed globally have seen inflows of $516 Bn, less than the $654 Bn in net inflows gathered in 2017.
Substantial inflows during December can be attributed to the top 20 ETFs by net new assets, which collectively gathered $40.79 Bn. The iShares 1-3 Year Treasury Bond ETF (SHY US) gathered $3.36 Bn, the largest net inflow in December.
Top 20 ETFs by net new assets December 2018: Global
| Name | Ticker | Assets (US$ Mn) Dec-18 |
ADV (US$ Mn) Dec-18 |
NNA (US$ Mn) YTD 2018 |
NNA (US$ Mn) Dec-18 |
| iShares 1-3 Year Treasury Bond ETF | SHY US | 20,624 | 431 | 9,288 | 3,357 |
| iShares Short Treasury Bond ETF | SHV US | 20,690 | 346 | 12,672 | 3,340 |
| iShares Core U.S. Aggregate Bond ETF | AGG US | 57,078 | 751 | 5,559 | 2,669 |
| iShares Russell 1000 Value ETF | IWD US | 37,631 | 740 | 581 | 2,544 |
| iShares Core S&P 500 ETF | IVV US | 147,540 | 2,061 | 18,592 | 2,470 |
| Reliance CPSE ETF | CPSEBE IN | 4,063 | 22 | 2,344 | 2,344 |
| Vanguard Short-Term Bond ETF | BSV US | 27,945 | 311 | 4,149 | 2,332 |
| iShares Russell 1000 ETF | IWB US | 17,920 | 436 | (1,483) | 2,205 |
| TOPIX Exchange Traded Fund | 1306 JP | 71,167 | 26 | 22,288 | 2,166 |
| Vanguard FTSE Developed Markets ETF | VEA US | 65,145 | 1,347 | 9,639 | 2,080 |
| Vanguard Total Stock Market ETF | VTI US | 93,577 | 939 | 9,848 | 1,987 |
| iShares MSCI ACWI ETF | ACWI US | 10,604 | 543 | 2,897 | 1,931 |
| SPDR Bloomberg Barclays 1-3 Month T-Bill ETF | BIL US | 8,668 | 197 | 6,724 | 1,696 |
| iShares MSCI USA Minimum Volatility ETF | USMV US | 18,997 | 378 | 4,223 | 1,638 |
| iShares MSCI ACWI ex U.S. ETF | ACWX US | 4,783 | 231 | 2,098 | 1,466 |
| iShares MSCI EAFE ETF | EFA US | 62,059 | 3,386 | (10,621) | 1,419 |
| Daiwa ETF TOPIX | 1305 JP | 34,176 | 6 | 11,166 | 1,355 |
| SPDR S&P Dividend ETF | SDY US | 16,356 | 169 | 836 | 1,309 |
| Listed Index Fund TOPIX | 1308 JP | 31,765 | 5 | 9,198 | 1,264 |
| iShares National Muni Bond ETF | MUB US | 11,862 | 203 | 2,433 | 1,213 |
The top 10 ETPs by net new assets collectively gathered $3.84 Bn by the end of December 2018.
Top 10 ETPs by net new assets December 2018: Global
| Name | Ticker | Assets (US$ Mn) Dec-18 |
ADV (US$ Mn) Dec-18 |
NNA (US$ Mn) YTD 2018 |
NNA (US$ Mn) Dec-18 |
| SPDR Gold Shares | GLD US | 31,518 | 1,010 | (1,815) | 1,057 |
| iShares Physical Gold ETC | SGLN LN | 4,350 | 3 | 1,170 | 635 |
| NH QV KOSPI Volatility Matching Strangle ETN 57 | 550057 KS | 629 | 0 | 623 | 623 |
| Invesco Gold ETC | SGLD LN | 4,932 | 5 | 315 | 363 |
| iShares Gold Trust | IAU US | 11,545 | 158 | 1,599 | 345 |
| ETFS Physical Gold | PHAU LN | 6,662 | 8 | 536 | 295 |
| VelocityShares 3x Long Crude Oil ETN | UWT US | 393 | 130 | 514 | 224 |
| Xtrackers Physical Gold ETC (EUR) | XAD5 GY | 2,536 | 1 | 1,884 | 110 |
| Xtrackers Brent Crude Oil Booster Euro Hedged ETC | XETC GY | 248 | 1 | 142 | 97 |
| ProShares Ultra DJ-UBS Crude Oil | UCO US | 351 | 64 | (45) | 92 |
Investors have tended to invest in short duration fixed income, market cap and lower cost ETFs in December.
Article by ETFGI

