Euclidean Technologies commentary for the third quarter ended September 31, 2018; titled, “Overfitting & Underfitting – Machine Learning In Equity Investing.”
Q3 hedge fund letters, conference, scoops etc
Year-to-date through September, Euclidean Fund I was up 9.8% net of fees and expenses in the context of the S&P 500 delivering a 10.6% total return, including dividends. These returns come in the context of an environment that has not been kind to value investors. [1] Through the first nine months of the year, the general dominance of expensive growth stocks continued and, moreover, unprofitable companies outperformed the market.
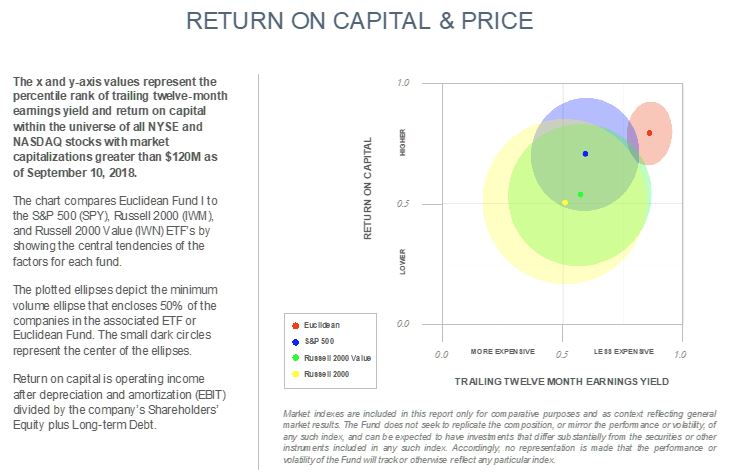
To have context for our results and to understand how we are positioned, please examine these two views into Euclidean’s portfolio [i]. They hint at both why we are optimistic about Euclidean’s potential for future returns as well as why the market’s embrace of expensive and profitless companies has been a headwind for our strategy. We believe that our style of investing will distinguish itself when profitable companies are in favor and valuation multiples compress – developments we think are likely to eventually come.
In the meantime, we continue to refine how we invest by marrying our experiences, logic, and the use of machine learning. Our aim is to ever strengthen Euclidean’s process for assessing how individual companies’ financials may evolve, so that we identify companies where investors’ expectations (and thus current market values) have a good probability of proving too low.
Relating to these efforts, we thought this would be a good time to share our views on important topics related to investment model development, such as model overfitting and the non-stationary qualities of financial markets. These topics are important to keep in mind whenever you are looking at a quantitative approach to investing. So, hopefully, this letter will provide you some visibility into how we think about them at Euclidean.
Machine Learning and Equity Investing
There is an abundance of randomness, noise, and ambiguity in financial markets, caused by the fact that humans, with their emotions and whims, are inexorably wrapped up in the process of setting market prices. This has led some to conclude that sophisticated machine learning models, such as neural networks and ensembles of decision trees, are doomed to be misled by all the noise. The feared outcome is that these models are likely to overfit the data, finding spurious relationships instead of persistent principles.
This perspective has been fostered by another observation, which is that some of the biggest achievements in the field of deep (machine) learning are with games, such as video games, chess, and the game of Go. While these games are complex, they are unlike financial markets as they have well-defined rules.
In many ways, we think that such concerns about machine learning are misguided. After all, machine learning has also proven successful in very noisy domains, such as voice recognition and computer vision. Moreover, as we describe in this letter, machine learning offers an arsenal of tools expressly designed to tease out the signal in noisy data and prevent overfitting.
But before we jump ahead in our discussion, it is illustrative to describe what we have seen so far in Euclidean’s decade-long investigation of the application of machine learning to long-term investing. We have made three high-level observations in our research that relate to the above perspectives:
- When we attempted to forecast future returns from past fundamental data and momentum using off-the-shelf deep learning techniques, they performed no better than a simple linear model at the task. [2]
- When we attempted to forecast future fundamentals from past fundamentals and momentum, again using deep learning techniques, we had success (albeit modest) over a linear model. [3]
- We have seen better results with ensembles of decision trees when we formulate the challenge of long-term investing as a classification problem. That is, instead of trying to forecast future returns from past fundamentals, we attempted to forecast whether an investment would have a good or bad outcome, and we found that this was more successful.
This may be the end of the story. Maybe we have taken machine learning’s application to equity investing as far as it can go. However, recent history provides a cautionary tale for those who assume machine learning is unlikely to have a transformational impact on long-term equity investing and quantitative finance.
Consider these three very noisy and computationally challenging problems: computer vision, language translation, and voice recognition. It wasn’t so long ago that the best-performing technologies for these tasks were not based on machine learning and their performance, in general, was terrible (often worse than what a child could do). For example, you might have once reasonably held the opinion that the future of speech recognition would come from traditional approaches such as Hidden Markov Models. [4] But then something extraordinary happened. In all three domains, though not necessarily at the same time or for the same reasons, the performance of deep neural networks vaulted ahead of traditional approaches, often exceeding expert human performance in these fields. [5] [6]
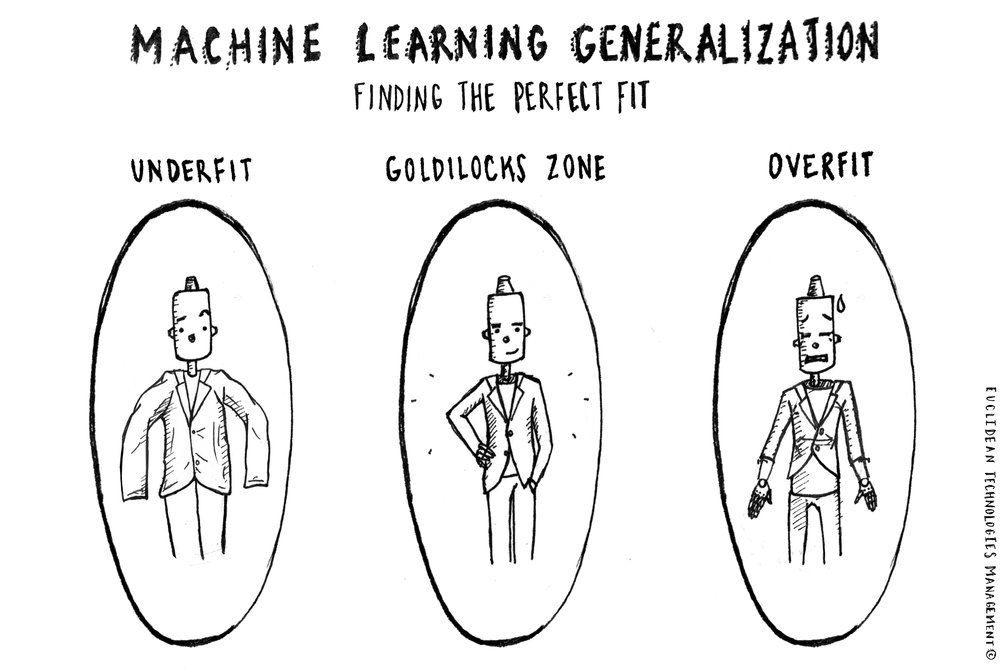
In this letter, we dig into a few of the points introduced above to explain why we continue to push our research forward, searching for ever-more effective methods of evaluating individual companies as long-term investments. First, we discuss that when using machine learning to build models, there is in fact a spectrum, where on one end the model is underfit and on the other it is overfit. The objective is to find a Goldilocks point – not too overfit and not too underfit – somewhere in the middle, where a model successfully captures persistent relationships in the data and achieves “good generalization.”
Then, we discuss how we view the use of machine learning in a world where the rules are not fixed. After all, in environments characterized by extremely non-stationary rules, any lesson learned in one time period may be of little value in the next. But, this limitation exists for humans and traditional methods of statistics, not only for machine learning. As we explain, however, there are ways to frame investment objectives that help mitigate this problem and there are also tools that we can employ that improve model performance when data is mildly non-stationary or changing slowly through time.
Overfitting (and Underfitting) Models
There are many types of machine learning, but the one known as supervised learning is the most common form. The idea behind supervised learning is that a model is responsible for mapping inputs to outputs. In image recognition, the input might be an image (e.g., a grid of numbers representing the color and intensity of pixels in a scene) and the output might be a description of the image (e.g., a cat on a chair). In language translation, the input might be an English sentence and the output might be the same sentence in French. For Euclidean, the input might be a variety of data about a company at a point in time, with the output being a “one” or “zero”, indicating whether or not the stock outperformed the market over the subsequent one-year period.
The way a model maps input to output is characterized by tunable parameters or weights. Just as on a piano, if you change the tension of the strings (tune them), the same set of key strokes (inputs) creates a different set of sounds (outputs). In a machine learning model, the weights are generally represented by numbers. There may be only a few such weights, as in a simple linear model of a few variables, or there may be tens of millions, as in the most sophisticated deep neural networks.
The weights in a machine learning model are determined during what is called the training phase. For this phase, examples of inputs and target outputs are collected. For example, if you want to train a model to translate English sentences to French sentences, you would need to collect many, many examples of English sentences and the corresponding French translations.
During the training phase, a learning algorithm attempts to find the weights that produce the smallest difference, or error, between the output produced by the model and the target outputs collected. To the extent that the collected data represents the true relationship between the inputs and the outputs, then minimizing the total error on the training data should produce a model that performs well on other data from the same distribution but not included in the sample – that is, on out-of-sample data.
But this is not the whole story. We must also confront the challenges of overfitting and underfitting. It is useful to illustrate with an example. In Figure 1 you can see some observed data, where x is the input and y is the output. In addition, we have fit a line to the observed data that minimizes the difference between the linear model’s output and the actual observed y.
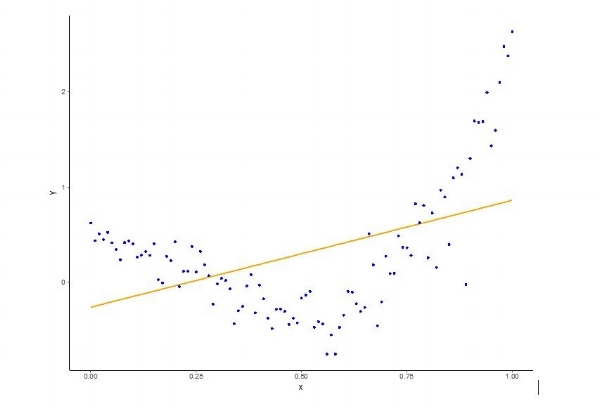
Figure 1 [7]
Obviously, there is some curvature (or non-linearity) to the data that can’t be captured by the linear model and so it is natural to ask whether a more expressive model (one with more curvature) can better fit the data.
So, instead of a simple linear model, we can try something more expressive, such as a three-degree polynomial of the following form:
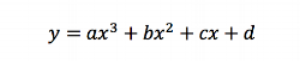
The three-degree polynomial with the best fit can be seen to the Figure 2. This clearly looks better and quantitatively, it is: The average absolute difference between the target output and the actual output for the three-degree polynomial fit is 0.17, whereas it is 0.51 for the linear model.
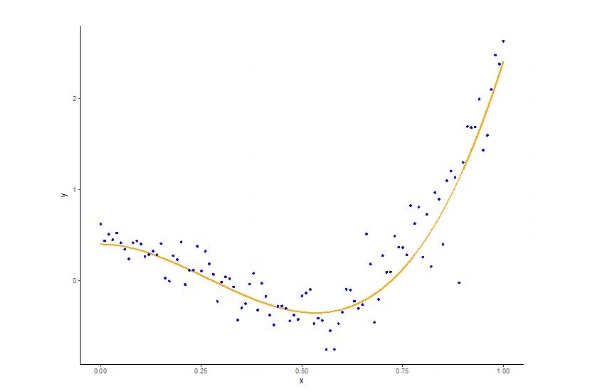
Figure 2
However, if the goal of learning is to minimize the difference between the actual and target outputs, then why not try to do even better? We might decide that a model that fits all 100 sample data points with zero error would be best. This fit can be achieved with a 99-degree polynomial and is shown in Figure 3.

Figure 3
But is this really the best fit? Intuitively, most people would agree that it doesn’t look right. While the first example doesn’t seem to follow the data distribution tightly enough, this example seems to follow it too closely. But can we quantify this intuition?
The point of building a model is to use it on new data to make future predictions of y when we encounter a new value of x. So, to that end, we examine what happens when we collect more data (say another 100 or so input-output examples) and evaluate our three models based on this new data. In the table below, we see that the out-of-sample error on the model that fit the in-sample data perfectly (the 99-degree polynomial) has a worse error rate on the out-of-sample data than the three-degree polynomial model.
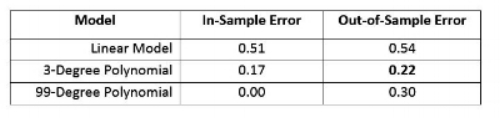
This result then motivates the following question: What is the out-of-sample error on all polynomials from degree 1 to degree 99? The result can be seen in the plot below.
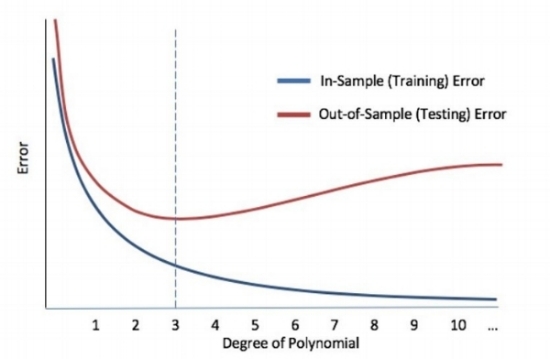
Figure 4
As can be seen in the plot, the minimum out-of-sample error is achieved with a three-degree polynomial. This is the point at which optimal generalization is achieved. But how do we find this point when doing machine learning? In the next section, we will describe some tools from the large set that machine learning brings to bear on this problem.
Achieving Good Generalization in Machine Learning Models
For most supervised learning projects, the process of determining a model can be broken into three main strategies to achieve strong generalization. We will start backwards with the final strategy employed: out-of-sample testing.
Out-of-sample testing is the process wherein we test a model based on data that it has never been exposed to before. The typical procedure for this test is to set aside 10% to 30% of randomly chosen data and leave it untouched until a model is built and ready to be deployed. The performance on this test set is considered an estimate of the model’s generalization performance.
Now, beware. Imagine we tell you that if your out-of-sample test is not successful, you cannot go back and try again with a different approach. The reason is that if you iteratively build models, testing them based on the out-of-sample data and guiding your process by the success (or failure) of those tests, then you are essentially using the test data to train your model.
This may seem pretty nerve-racking! You won’t know if you have a successful model until the final step and if that last step yields a failed test, you are stuck.
Thankfully, there are techniques for preventing overfitting before and during the training process, so that when it comes time to do the final out-of-sample test, you already have a good sense of how the model will perform.
Regularization
Occam’s razor is a philosophical principle attributed to the 14th-century Franciscan friar William of Ockham. It translates from Latin as “plurality should not be posited without necessity,” which is generally interpreted to mean that explanations, models, or theories should be no more complex than necessary. However, it is often misinterpreted as: The simplest model is the best model.
The distinction is important because in practice, one should add complexity up until the complexity stops improving a model’s performance. In this sense, the experiment summarized by Figure 4 above (which relates model complexity to out-of-sample performance) is doing just that – finding the point where increasing the number of model parameters adds no value. This process of controlling the complexity of the model to avoid overfitting and achieve good generalization is called “regularization.”
There are a myriad of forms of regularization in machine learning. The degree of regularization (how much you control a model’s capacity) is called a “hyper-parameter” and the process by which you find the appropriate degree of regularization is called a hyper-parameter search. One way to conduct a hyper-parameter search is to hold out a validation dataset that is randomly chosen from the training data.
Then, with the training data, you can fit many models with increasing (decreasing) levels of regularization. Each model’s performance is then tested on the validation data and, as in Figure 4, the model that couples the least complexity with the best validation performance is selected. This model is then tested on the test set to obtain an estimate of its out-of-sample performance.
There are many ways to improve this basic form of hyper-parameter search. Cross-validation [8], for example, allows the use of more data for training and less for testing while still achieving a good estimate of generalization performance. Also, certain techniques [9] better handle time series data, which is the form of most financial data.
In some domains, only through designing completely new model architectures have big breakthroughs in generalization performance been achieved [10]. The convolution neural network for computer vision [11] and the long-short-term-memory network [12] – a form of recurrent neural network – for time series are great examples. Each of these neural network architectures achieves good generalization performance by employing a form of regularization that is unique to the problem.
In our own research investigating the use of deep neural networks to forecast future earnings from past fundamentals, we use a form of regularization called multi-task learning. That is, instead of asking our model to just forecast earnings one year in the future, we ask it to forecast all income statement and balance sheet items one year into the future. This provides the model with considerably more signal during training and therefore can help avoid overfitting.
So, in summary, the key components of achieving good generalization (not underfitting or overfitting) in machine learning are hyper-parameter search, regularization, and out-of-sample testing. These techniques have enabled the development of extremely powerful models in a variety of noisy domains. [13]
Challenges Due to the Non-Stationary Aspect of Financial Markets
One common criticism of applying machine learning, and statistical methods in general, to the world of investing is that markets are non-stationary. That is, unlike in a game such as chess, the rules of investing are not fixed and what leads to good returns varies over time. But this criticism is not specific to the application of machine learning. Rather, it is a criticism of the application of inference. After all, whether you are a human or a machine, when operating in environments characterized by extremely non-stationary rules, any lesson learned in one time period may be of little value in the next.
Our views on the implications for Euclidean are informed by an analogy Benjamin Graham – the father of value investing – made 80 years ago. That is, in the short run, the market behaves like a voting machine but over the long run, the market more closely resembles a weighing machine. Graham’s point was that fear, greed, and other emotions (the voting machine) cause short-term market fluctuations that may be difficult to comprehend. Those fluctuations sometimes cause a company’s price to diverge significantly from the value implied by the company’s ability to generate cash for its owners. Over long periods of time, however, Graham observed that the weighing machine eventually kicks in as companies’ market values converge with their economic performance.
So, as your investment objective becomes longer term, it seems likely that you are dealing with a progressively more stationary problem. In the short term, prices can do just about anything. Investment fads come and go, and investor attention frequently turns to external developments that have little to do with companies’ future cash flows. Ultimately, however, the relationship between companies’ market values and their cash flows seems to rule the day. Specifically, when stock prices have gotten very high in relation to corporate cash flows, they have subsequently underperformed. And, when stock prices have dropped very low in relation to corporate cash flows, they have tended to deliver better-than-average returns. [14]
We have demonstrated this to our own satisfaction by training models on deep history and then successfully testing them on more recent, out-of-sample examples. So, we are convinced that equity investing, over the long term, is stationary enough for machine learning to yield good results.
Yet, “stationary enough” does not mean completely stationary. Over time, tax and regulatory regimes have shifted, accounting rules have changed, transaction costs have come way down, the types of companies and margin profiles that characterize a given country’s stock market have evolved, and so on. As a result, there may be important lessons that dissolve and emerge over time that are helpful in assessing the underlying character and investment potential of individual companies.
Thankfully, there are tools that can be employed in machine learning when you have a data distribution that is slowly changing (weakly non-stationary) through time. For example, in our research on forecasting future fundamentals from past fundamentals, one approach we tested was to iteratively build models on a 30-year moving window of trailing data. That is, for each year Y we built a model based on data from the period Y – 30 to Y – 1, so that the model used in the year 2000 was built on data from the period ranging from 1969 to 1999 and the model used in 2018 was built on data from the period dating from 1987 to 2017.
By using practices like these, we can evolve our models through time, biasing them to more recent data and accounting for some of the non-stationary aspects of long-term equity investing.
Summary
As far back as data lets us see, it seems that adhering to simple rules for investing in inexpensive companies would have served investors well. [15] This led us to start Euclidean and pursue the opportunity to do even better by taking a deeper look at companies’ fundamentals. We wanted a process-driven approach, informed by the lessons of history, for investing our own money. And we suspected that some of you wanted the same thing.
We initially constructed our approach using the tools of machine learning to digest the financial statements and investment outcomes of public companies going back many years. This gave us a basis for evaluating today’s equity investment options in light of how similar opportunities in the past actually performed. But the journey was just beginning.
Since our firm’s inception, the tools for doing our work have become increasingly sophisticated. At the same time, much more data has become available for analysis, while our experience with what it takes to successfully apply a commercial investment strategy continues to deepen. Thus, the way we operate continues to evolve as we seek to capitalize on new insights that we believe can improve our investment process.
We hope that letters such as these keep you connected to the effort we make to be good stewards of your hard-earned assets. We want you to be an informed Euclidean investor and we are available to discuss the content shared here, individual positions in our portfolio, or any questions you might have. Please call us at any time, as we always enjoying hearing from you.
Best Regards,
John & Mike
The opinions expressed herein are those of Euclidean Technologies Management, LLC (“Euclidean”) and are subject to change without notice. This material is not financial advice or an offer to purchase or sell any product. Euclidean reserves the right to modify its current investment strategies and techniques based on changing market dynamics or client needs.
Euclidean Technologies Management, LLC is an independent investment adviser registered under the Investment Advisers Act of 1940, as amended. Registration does not imply a certain level of skill or training. More information about Euclidean including our investment strategies, fees and objectives can be found in our ADV Part 2, which is available upon request.
[1] WSJ | Unprofitable Firms Are Outperforming Other Growth Stocks
[2], [3] Improving Factor-Based Quantitative Investing by Forecasting Company Fundamentals
[4] Wikipedia – Speech Recognition, Modern Systems
[5] NYTimes – The Great AI Awakening
[6] Improving Factor-Based Quantitative Investing by Forecasting Company Fundamentals
[7] The charts presented herein, referenced as Figures 1-4 as well as the In-Out of Sample Error chart, are for illustrative purposes only and are included to help describe the concepts discussed in the context of machine learning. These charts were created internally by Euclidean Technologies Management, LLC and should not be viewed as industry guidance. Please see important disclosures at the end of this letter.
[8] Wikipedia – Cross-Validation
[9] Time Series Nested Cross-Validation
[10] Deep Learning in Neural Networks: An Overview
[11] Convolutional Neural Network
[12] Wikipedia – Long Short-Term Memory
[13] NYTimes – The Great AI Awakening
[14] NBR – Do Stock Prices Move Too Much To Be Justified By Subsequent Changes In Dividends?
[15] Tweedy, Browne Company – What Has Worked In Investing
Euclidean Fund I, LP Performance
Look Through Financials, as of Quarter End
These aggregated portfolio metrics reflect our systematic process for buying shares in historically sound companies when their earnings are on sale.
—
Ten Largest Holdings, as of Quarter End
This information provides a sense of Euclidean’s current portfolio and the individual positions provide a means of better understanding how our investment process seeks value.
—
net performance, fund lifetime
This section summarizes the investment results of Euclidean Fund I, LP since its fund inception in August 2008.
The charts below compare Euclidean Fund I to the S&P 500 (SPY), Russell 2000 (IWM), and Russell 2000 Value (IWN) ETF’s by showing the central tendencies of the factors for each fund