
HFM Insight’s latest update report covers the performance and assets under management of billion dollar hedge funds in April, alongside the HFM Indices performance.
[munger]
Q1 2021 hedge fund letters, conferences and more
Highlights:
- The average billion-dollar club (BDC) hedge fund is up 6.1% YTD after a 2.5% gain in April
- Event-driven BDC funds are the industry’s top-performing strategy group YTD, up 15.5%
- Overall, 82% of BDC hedge funds reported positive performance YTD through April
A summary is included below. If you require more information on this report, have data queries or interview requests, please do not hesitate to contact me. As a reminder, with Pageant Media’s acquisition of Eurekahedge, you now have insights from both HFM and Eurekahedge when it comes to information and data requests – feel free to check in about data from either brand.
Billion Dollar Club
Hedge funds managing over $1bn outperformed their sub-$1bn peers in April, aided by another surge in event-driven performance. BDC hedge funds rose 2.5% last month compared to an average 2.2% gain in the sub-BDC range, but the latter group remains ahead YTD, up 7.6% versus a BDC gain of 6.1%. A renewal in corporate dealmaking helped merger arbitrage advance in April to maintain the performance momentum in event-driven. The big gains gleaned from backing Spac-structures, which boosted returns in January and February, have been less of a recent performance driver. The two forces mean BDC event-driven funds are up 15.5% YTD, having gained 6.9% in April, their strongest month of 2021. There is optimism that Covid-19 unlocking will fuel higher M&A and continue the strategy’s strong performance; a marked turnaround from ‘arb-ageddon’ losses last year when spreads widened at the initial height of the pandemic.
Hedge fund performance | YTD through April 2021 (%)
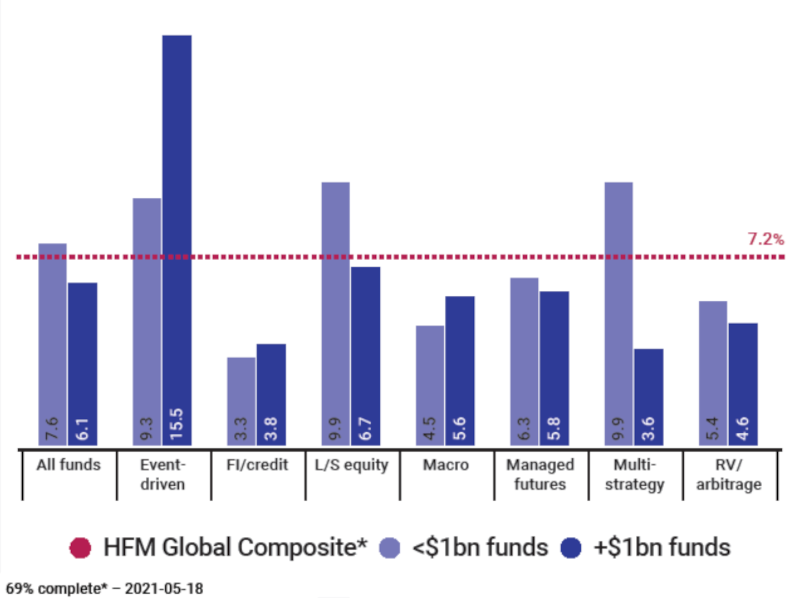
(Source: HFM Insights)
| HFM Benchmark | Apr-21 | Mar-21 | Feb-21 | Q2 2021 | 12 months | YTD 2021 | 2020 |
| HFM Global Composite | 2.2% | 0.9% | 2.8% | 2.2% | 25.6% | 7.2% | 11.5% |
| <$1bn hedge funds | 2.2% | 0.9% | 2.8% | 2.2% | 27.4% | 7.6% | 13.0% |
| +$1bn hedge funds | 2.5% | 0.7% | 2.3% | 2.5% | 21.1% | 6.1% | 9.2% |
| FoHF composite | 2.0% | 0.1% | 2.7% | 2.0% | 21.2% | 4.5% | 10.4% |
| S&P 500 | 5.2% | 4.2% | 2.6% | 5.2% | 43.6% | 11.3% | 16.3% |
Inflated expectations: With the possibility of rising prices replacing Covid-19 as the dominant market theme in the rest of 2021, BDC hedge funds need to rehone strategies and communicate to investors their specific approach to inflation. Funds that can identify the beneficiaries of higher financing costs and bet against the losers will gain most, according to Franklin Templeton: “We believe these strategies are particularly interesting now as a fixed income diversifier given the potential for renewed economic growth and an uptick in inflation.”
Overall industry AuM ($bn) | April 2021*
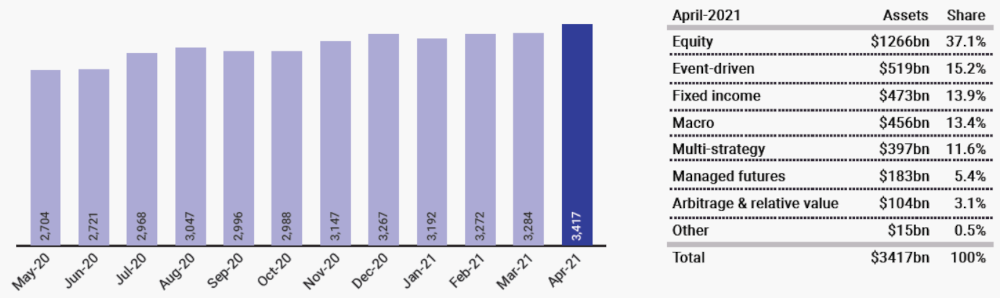
(Source: HFM Insights)
Analyst note: Data subject to future revision. * AuM managed by North American, APAC and European managers, excludes Ucits.
Hedge fund performance | 12m compound return
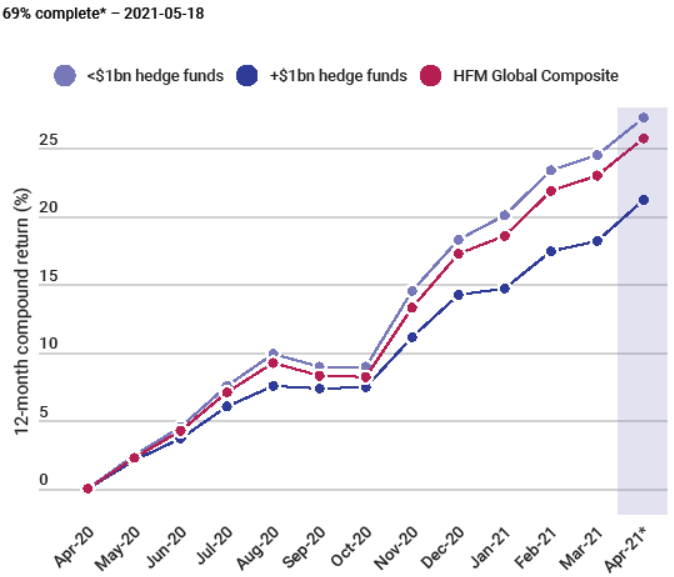
(Source: HFM Insights)
Analyst note: Indices are based on reported data at time of publication and are subject to future revision.
| HFM Benchmarks | 12m return | 12-month Sharpe | 3yr ann. return | 36-month Sharpe |
| <$1bn hedge funds | 27.2% | 4.5 | 30.0% | 3.8 |
| +$1bn hedge funds | 21.2% | 4.6 | 26.1% | 3.9 |
| HFM Composite | 25.7% | 4.4 | 26.6% | 3.4 |
HFM Indices Performance Tracker
| Fund | Apr-21 | Mar-21 | Feb-21 | Q2 2021 | 12 months | YTD | 3yr ann. |
| Event-driven | +$1bn | 6.9% | 1.1% | 4.3% | 6.9% | 48.0% | 15.5% | 9.2% |
| L/S equity | <$1bn | 2.7% | 0.5% | 4.0% | 2.7% | 41.4% | 9.9% | 12.5% |
| Multi-strategy | <$1bn | 1.3% | 0.8% | 1.9% | 1.3% | 30.2% | 9.9% | 10.2% |
| Event driven | <$1bn | 2.7% | 1.3% | 2.7% | 2.7% | 33.1% | 9.3% | 8.2% |
| HFM Global composite | 2.2% | 0.9% | 2.8% | 2.2% | 25.6% | 7.2% | 8.2% |
| L/S equity | +$1bn | 3.0% | 0.1% | 3.3% | 3.0% | 30.5% | 6.7% | 11.2% |
| Managed futures | <$1bn | 2.5% | 0.6% | 3.3% | 2.5% | 11.7% | 6.3% | 6.0% |
| Managed futures | +$1bn | 2.7% | 1.2% | 3.2% | 2.7% | 8.2% | 5.8% | 5.9% |
| Macro | +$1bn | 3.3% | 1.1% | 1.7% | 3.3% | 18.4% | 5.6% | 6.5% |
| RV/arbitrage | <$1bn | 0.8% | -0.1% | 2.1% | 0.8% | 24.2% | 5.4% | 11.4% |
| RV/arbitrage | +$1bn | 0.0% | -1.3% | 2.3% | 0.0% | 22.9% | 4.6% | 9.8% |
| Macro | <$1bn | 1.6% | 0.6% | 2.1% | 1.6% | 19.6% | 4.5% | 8.0% |
| FoHF composite | 2.0% | 0.1% | 2.7% | 2.0% | 21.2% | 4.5% | 5.9% |
| Fixed income/credit | +$1bn | 0.5% | 0.5% | 0.9% | 0.5% | 19.2% | 3.8% | 5.5% |
| Multi-strategy | +$1bn | 0.8% | 0.9% | 1.0% | 0.8% | 11.4% | 3.6% | 5.3% |
| Fixed income/credit | <$1bn | 0.5% | 0.7% | 0.9% | 0.5% | 17.8% | 3.3% | 6.7% |
(Source: HFM Insights)
About HFM
HFM provides hedge fund professionals with an unparalleled blend of business essential data, exclusive industry intel and market-leading events. Combining 22 years of industry heritage with a cutting-edge platform, to create true business intelligence; the intelligence needed to raise assets, allocate funds or source new business opportunities. Insights is the research and analysis service from Pageant Media, sitting within the company’s hedge fund intelligence network, HFM. The division produces research reports and analytical articles on a variety of topics in the global hedge fund industry, including business operations, investor relations, technology and regulation. Leveraging Pageant’s wealth of data and news sources, and with access to the HFM network’s vast membership, Insights is uniquely positioned, offering exclusive surveys and expert commentary. Learn more about HFM.

