
3 Quickfire charts on US bond market sentiment… some of these sentiment charts are clearly at an extreme – and that’s usually when you go looking for contrarian signals. But then I look at a lot of charts on the bond market and it’s quite easy to make a case for a major trend change.
[REITs]
Q3 hedge fund letters, conference, scoops etc
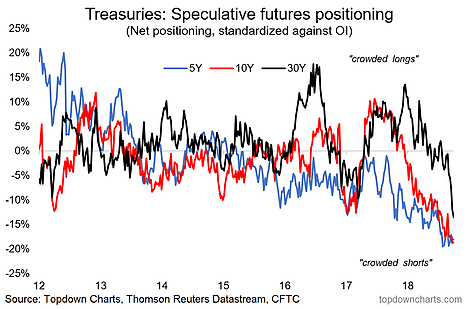
- Speculative futures positioning: The standout here is speculative futures positioning in the 30 year… gone from around neutral to extreme short. Total capitulation.
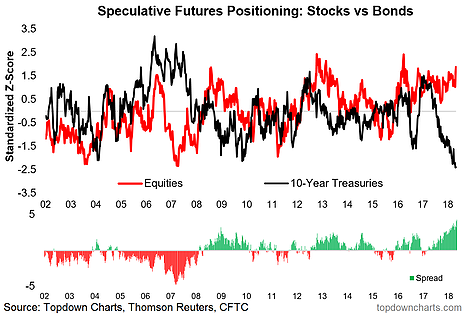
- Stocks vs Bonds futures positioning: This one shows were equity vs bond market futures positioning lies right now – notice how the gap is at a record high. Traders are doubling down on growth/inflation here.
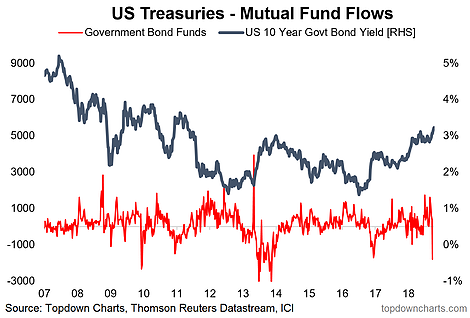
- Bond mutual fund flows: Last one shows a massive lurch in bond fund flows, with net-outflows the most extreme since the taper tantrum.
Looking for deeper insights? Try taking a free trial of our institutional research service
Article by Top Down Charts

