
The “stock market,” at least as measured via the S&P 500, has been on an epic performance run — especially relative to almost all asset classes. It doesn’t matter whether you look at the other asset classes by geography (e.g., US, developed, emerging), style (e.g., value, momentum), or type (e.g., stocks, bonds, commodities), one thing is clear: the S&P 500 is king.
Q3 hedge fund letters, conference, scoops etc
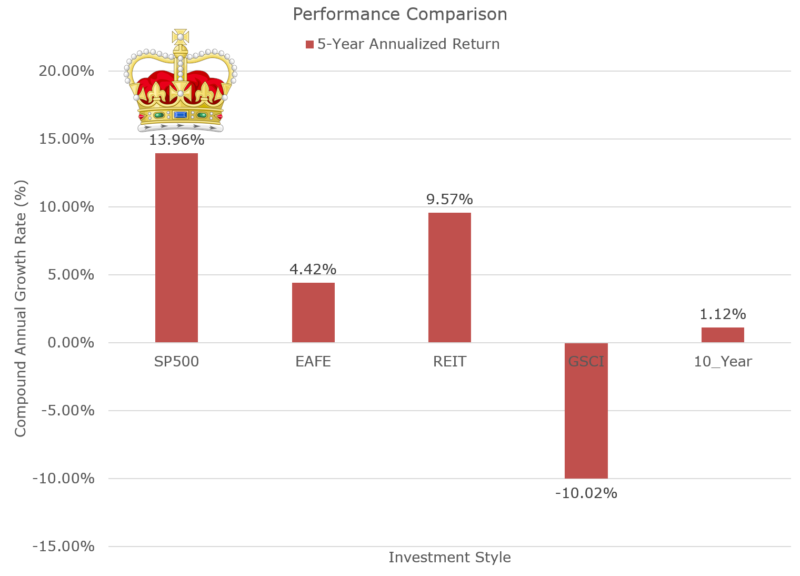
Below is a chart of the “Ivy 5,” which is a simple way to view asset classes (made popular by Meb Faber). 5-Year total return performance is from 10/1/2013 to 9/30/2018.
- US Stocks = SP500 = SP500 Total Return Index
- Int’l Stocks = EAFE = MSCI EAFE Total Return Index
- Real Estate = REIT = FTSE NAREIT All Equity REITS Total Return Index
- Commodities = GSCI = Goldman Sachs Commodity Index (GSCI) Index
- Bonds = 10-Year = Merrill Lynch 7-10 year Government Bond Index
The results are hypothetical results and are NOT an indicator of future results and do NOT represent returns that any investor actually attained. Indexes are unmanaged, do not reflect management or trading fees, and one cannot invest directly in an index. Additional information regarding the construction of these results is available upon request.
Diversification was the “loser’s game,” and investing all-in on the S&P 500 would have been your best bet.(1)
The incredible recent performance of the S&P 500, especially relative to so-called “active” strategies, has caused many market commentators to make claims that reflect partial truths:
- Factors are dead
- Value is dead
- Momentum is dead
- XYZ is dead…
The problem with all of these statements is that the S&P 500 (a.k.a., mega-cap U.S. stocks) has beaten essentially every investment style and every asset class on planet earth the past 5-years.
While these statements are correct on the surface, the implications are misleading.
In this post, by analyzing the past 5-year performance metrics of common factor strategies, we identify the following four facts for you:
- The S&P 500 gives you mega-cap beta exposure.
- Owning mega-cap stocks was the way to go over the last five years.
- Implication: Market-cap weighted looked great relative to equal-weight portfolios and/or non-mega-cap portfolios.
- Momentum (e.g., past 2-12 relative strength) is not dead.
- Implication: No indications that momentum should be abandoned.
- Value (e.g., high book-to-market) looks dead in large-caps, but hope exists for smaller stocks.
- Implication: Investors with large/mega-cap-focused value exposures may want to consider a change.
S&P 500 is a Form of Factor Investing: Large/Mega-cap Beta
Here is a plot from our visual active share tool highlighting the distribution of exposure for the S&P 500 (as measured via SPY holdings) and the total US Stock market (as measured via Vanguard VTI holdings). The X and Y-Axis reflect market capitalization. Holdings of each ETF are percentile-ranked against the universe on market cap and plotted below (100% = AAPL, AMZN, MSFT type stocks; 0% = things you’ve never heard of).
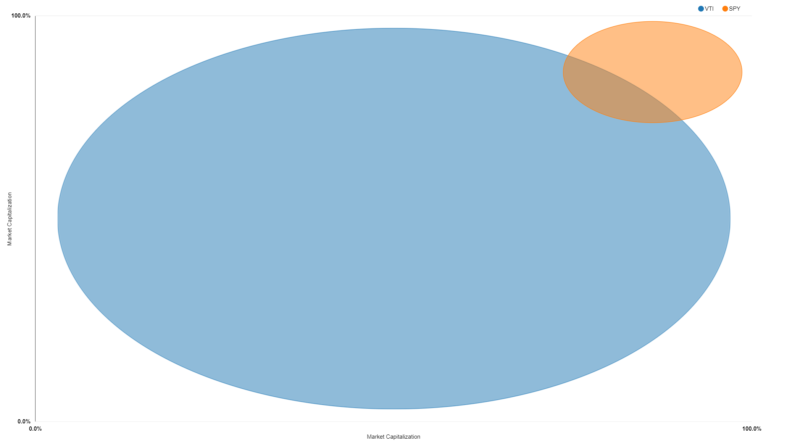
Source: https://tools.alphaarchitect.com/visual-active-share
I think that image does a pretty good job of confirming our first fact: The S&P 500 is clearly a strong active bet on mega-caps.
Mega Caps Drive Performance (Over the last five years)
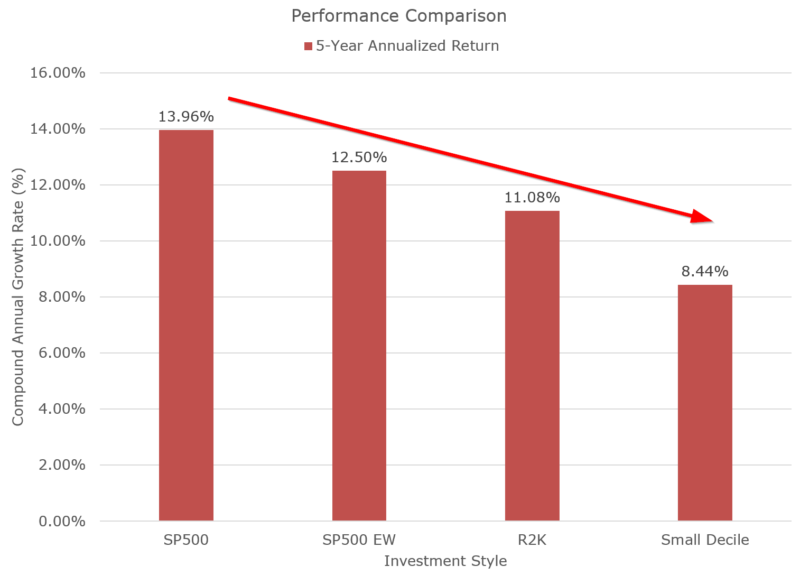
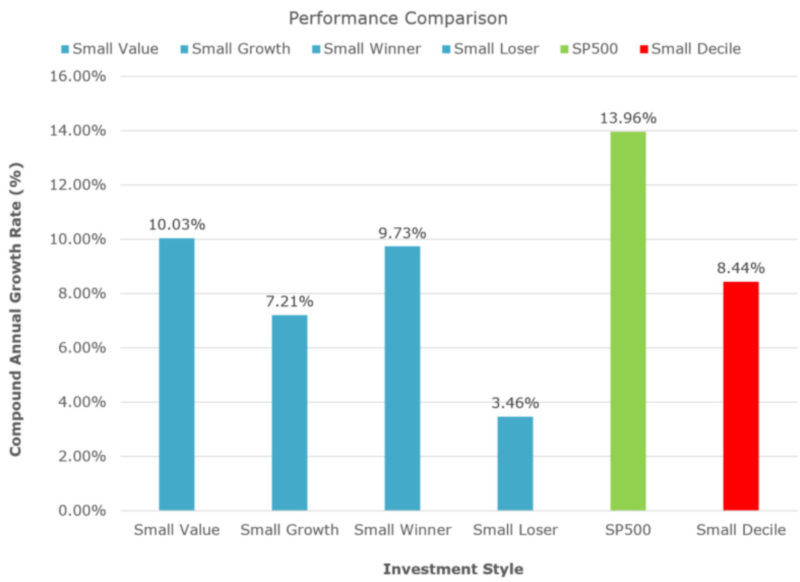
If we consider the S&P 500 to be a fund that gives you exposure to the mega-cap factor, and not magical pixie dust from the investment gods, the S&P 500’s recent relative performance is not surprising. To show this, let’s look at performance metrics across increasingly “small-cap-exposed” portfolios over the past 5 years, with S&P 500 having the lowest exposure and the “Small Decile” portfolio having the most exposure:
- SP500 = SP500 Total Return Index
- SP500 EW = SP500 Equal-Weight Total Return Index
- R2K = Russell 2000 Total Return Index
- Small Decile = Bottom decile market-cap (market-cap-weighted) from Ken French’s website
- All returns throughout this piece are total returns and include distributions.
The results are hypothetical results and are NOT an indicator of future results and do NOT represent returns that any investor actually attained. Indexes are unmanaged, do not reflect management or trading fees, and one cannot invest directly in an index. Additional information regarding the construction of these results is available upon request.
Now our second fact is proven: Any strategy that placed generic bets on non-mega caps took it on the chin relative to the S&P 500. (13.96% all the way down to 8.44%)
And that takes us to our last two questions. Are we in a new world where growth and mega-cap beta have killed momentum and value investing?
The Interaction between Size and Factors.
Lu Zhang and his colleagues have a recent paper on replicating anomalies, which highlights the importance of controlling for size when reviewing various factor anomalies. The key point is that factors act differently (and often much better) outside the mega-cap stock universe. As we’ve covered though, over the last five years U.S. large-cap beta has crushed just about everything.
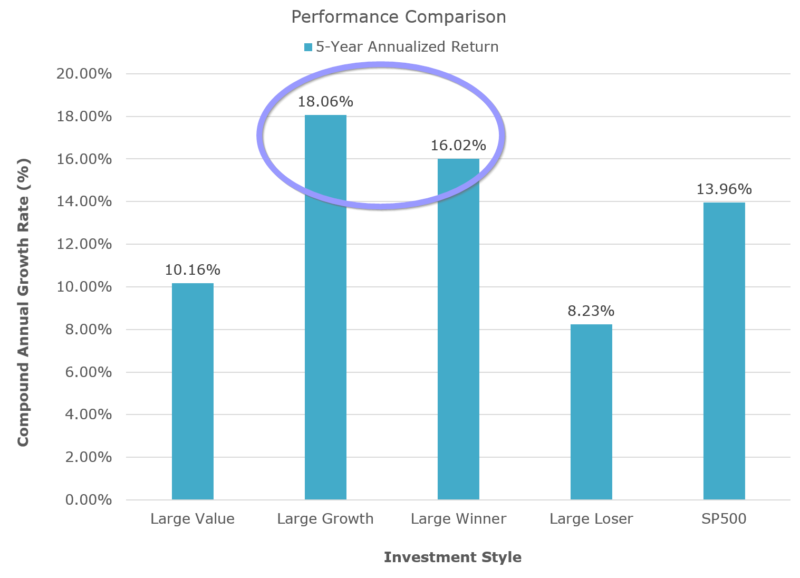
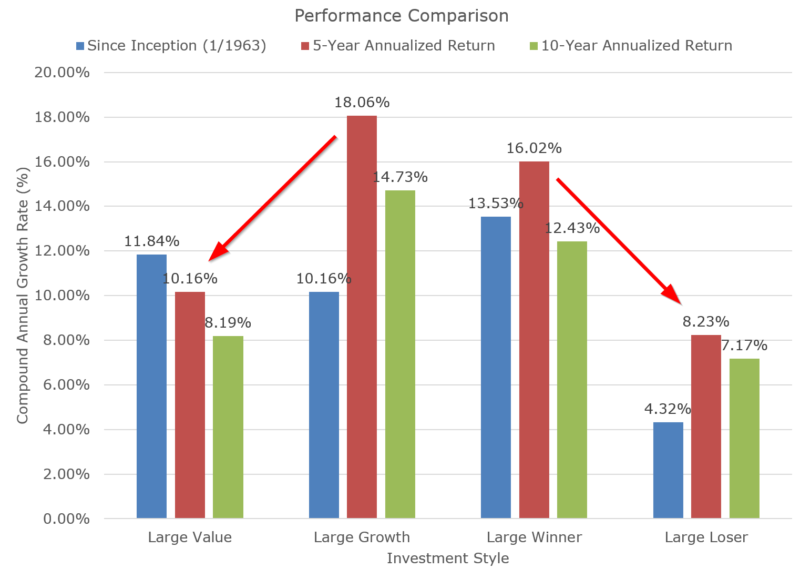
Instead of breaking down the investment universe by size (as we did above), we’ll now analyze the investment universe by the large value and large momentum factors relative to the S&P 500. Below is a chart of the past recent performance on generic large value/growth (to represent value) and large winner/loser ( to represent momentum) portfolios from Ken French’s site:(2)
The results are hypothetical results and are NOT an indicator of future results and do NOT represent returns that any investor actually attained. Indexes are unmanaged, do not reflect management or trading fees, and one cannot invest directly in an index. Additional information regarding the construction of these results is available upon request.
To summarize the recent results:
- Large value has been a tragic bet (FWIW, large value has never been a great bet!) (10.16% for large value vs. 18.06% on large growth and 13.96% on the market)
- Large growth has been en fuego! (18.06%!)
- Large momentum has done well (16.02% vs. 8.23% on momentum and 13.96% on the market)
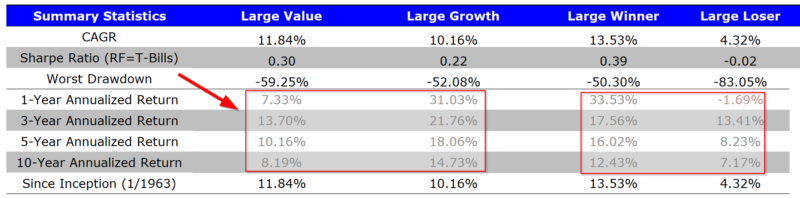
From a factor perspective, large-cap growth and momentum (a.k.a, S&P 500-ish) have been a killer combo. Market commentators are correct if they say that large-cap value really stunk (at least based on price-to-book). Maybe this isn’t too surprising, as large-cap value has never really been a compelling factor when assessed in different markets and time periods. In fact, including a mega/large-cap value exposure in a portfolio is arguably a “bad” idea when considering transaction costs, tax drag, and complexity. Below are the statistics on the various factors since inception (starts in 1963, 5-year, and 10-year annualized returns):
The results are hypothetical results and are NOT an indicator of future results and do NOT represent returns that any investor actually attained. Indexes are unmanaged, do not reflect management or trading fees, and one cannot invest directly in an index. Additional information regarding the construction of these results is available upon request.
Over the long-haul, mega-cap value beats growth (by a bit) and mega-cap winners beat losers (by a lot!).
What About Small-Cap Factors?
At the outset, we mentioned that the S&P 500, from a factor investing perspective, is a mega-cap beta fund (and one could argue it also has growth/momentum tilts). Mega-caps crushed the competition, and if you had growth or momentum exposures on top of your mega-cap exposures, you were essentially unbeatable.
But what if we look outside of the mega-cap world?
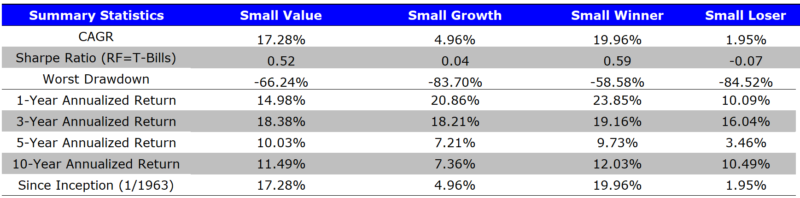
Below is a chart of the past recent performance (five years) on generic small value/growth (“value”) and small winner/loser (“momentum”) portfolios from Ken French’s site:(3)
The results are hypothetical results and are NOT an indicator of future results and do NOT represent returns that any investor actually attained. Indexes are unmanaged, do not reflect management or trading fees, and one cannot invest directly in an index. Additional information regarding the construction of these results is available upon request.
More recent small-cap factor performance (e.g., last 5-years) is a bit different than the large-cap results and tells a story we already know and discuss frequently on this blog:
- Value works in small-caps (10.03% vs. 7.21%)
- Momentum works in small-caps (putting aside transaction cost debates) (9.73% vs. 3.46%)
So after controlling for market-cap exposures the “factors are dead” argument doesn’t seem to be very compelling. Hooray! We’ve proved our last two facts from above.
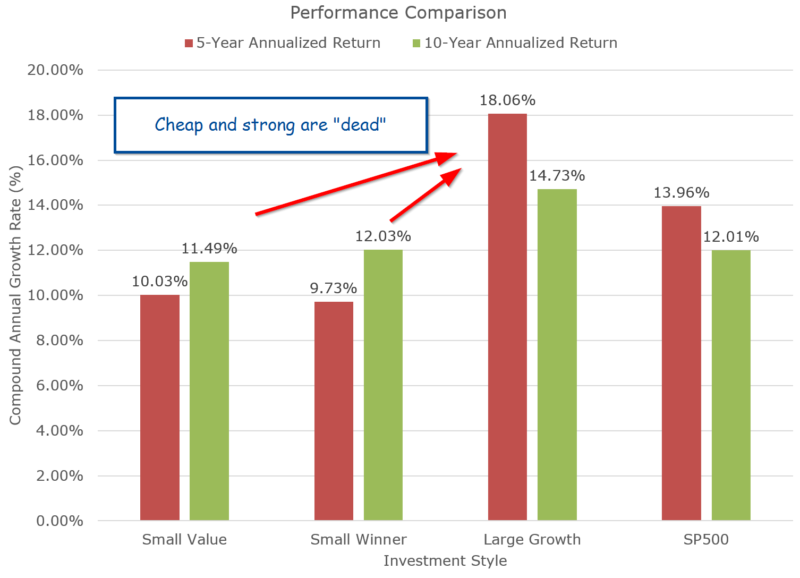
But…there is another obvious point here worth highlighting — everything is dead when compared to the S&P 500!
If one compares the 5-year (and even 10-year) performance of small-cap value and momentum against the S&P 500 (or closet indexing vehicles that essentially mirror the performance), an interesting story reemerges: factors stink.
The results are hypothetical results and are NOT an indicator of future results and do NOT represent returns that any investor actually attained. Indexes are unmanaged, do not reflect management or trading fees, and one cannot invest directly in an index. Additional information regarding the construction of these results is available upon request.
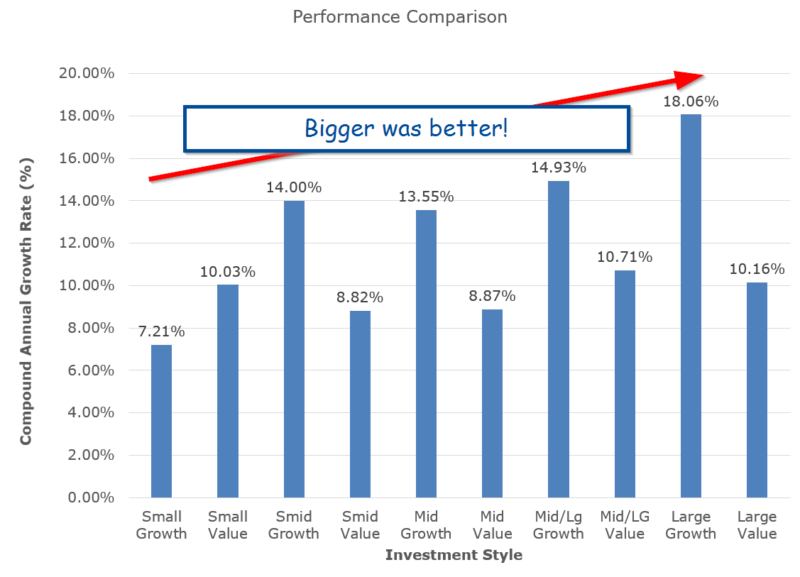
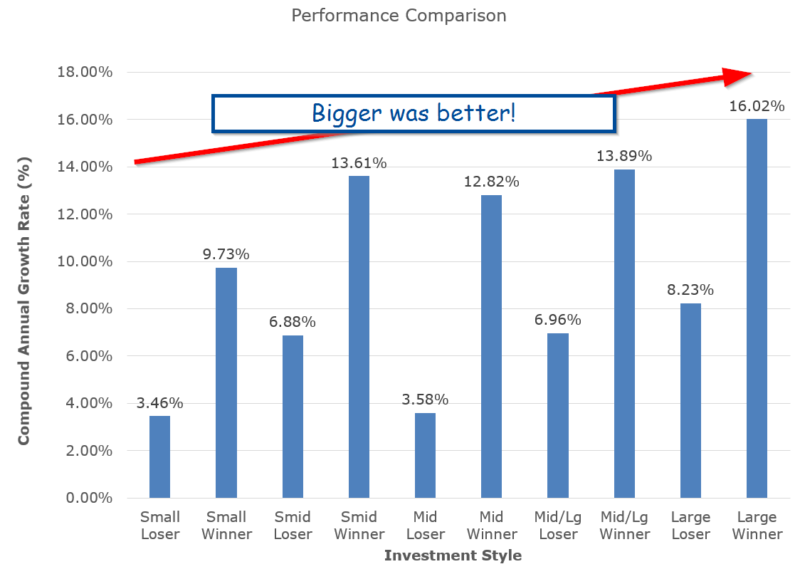
Finally, if we look at value and momentum across 5 different size buckets, we glean some additional insights on the past 5 years
First, a plot of 5 value/growth portfolios bucketed by size:
The results are hypothetical results and are NOT an indicator of future results and do NOT represent returns that any investor actually attained. Indexes are unmanaged, do not reflect management or trading fees, and one cannot invest directly in an index. Additional information regarding the construction of these results is available upon request.
Conclusion: Large beat small across the board and value was beaten up across the board, save small-caps.
First, a plot of 5 loser/winner momentum portfolios bucketed by size:
The results are hypothetical results and are NOT an indicator of future results and do NOT represent returns that any investor actually attained. Indexes are unmanaged, do not reflect management or trading fees, and one cannot invest directly in an index. Additional information regarding the construction of these results is available upon request.
Conclusion: Large beat small across the board and momentum worked across all size buckets.
Conclusions
The intent of this piece is to give readers a more nuanced view of common investment factors and how they have fared relative to the so-called “market,” which is often considered the S&P 500 Index. Long story short, everything has looked poor relative to the S&P 500. The S&P 500 delivers exposure to mega-cap beta, an exposure that has crushed almost all other asset classes the past five years.
We also identified that momentum is not dead and has shown promise in both large and small caps.
On the other hand, value might be dead, at least in large and mega caps.(4)
- The views and opinions expressed herein are those of the author and do not necessarily reflect the views of Alpha Architect, its affiliates or its employees. Our full disclosures are available here. Definitions of common statistics used in our analysis are available here (towards the bottom).
- Join thousands of other readers and subscribe to our blog.
- This site provides NO information on our value ETFs or our momentum ETFs. Please refer to this site.
References
1. albiet a risky bet, ex-ante!
2. Ken French’s website:Link to data here and link to details here. Large could be considered mega-cap as well. The cutoff for market caps is the 80th percentile breakpoint based on NYSE stocks and the portfolios are market-cap weighted.
Here is a detailed explanation from Ken French on the 5×5 momentum portfolio, which is where we get the large-cap winner data (similar idea for value):
The portfolios, which are constructed monthly, are the intersections of 5 portfolios formed on size (market equity, ME) and 5 portfolios formed on prior (2-12) return. The monthly size breakpoints are the NYSE market equity quintiles. The monthly prior (2-12) return breakpoints are NYSE quintiles.
Below is a chart of the past performance from 1963 to 9/30/2018 on generic large value and large growth portfolios from Ken French’s site: Ken French’s website:Link to data here and link to details here.
The results are hypothetical results and are NOT an indicator of future results and do NOT represent returns that any investor actually attained. Indexes are unmanaged, do not reflect management or trading fees, and one cannot invest directly in an index. Additional information regarding the construction of these results is available upon request.
3. Below is a chart of the past performance from 1963 to 9/30/2018 on generic small value and small growth portfolios from Ken French’s site:Ken French’s website:Link to data here and link to details here.
The results are hypothetical results and are NOT an indicator of future results and do NOT represent returns that any investor actually attained. Indexes are unmanaged, do not reflect management or trading fees, and one cannot invest directly in an index. Additional information regarding the construction of these results is available upon request.
4. I’m secretly trying to play psychology tricks on the market and hoping that by claiming that value is dead, it will stage a reversal!
The post “Factor Investing Fact Check: Are Value And Momentum Dead?” appeared first on Alpha Architect.

