
And the Winner is…
Q3 2019 hedge fund letters, conferences and more
SUMMARY
- As in 2018, Low Volatility produced the best and Value the worst performance
- Value did not recover significantly further after a short rally in Q3 2019
- However, Momentum broke its upward trajectory since then
INTRODUCTION
We present the performance of five well-known factors on an annual basis for the last 10 years. We only present factors where academic research highlights positive excess returns across market cycles and asset classes. Other strategies like Growth might be widely-followed investment styles, but lack academic support and are therefore excluded.
METHODOLOGY
The factors are created by constructing long-short beta-neutral portfolios of the top and bottom 10% of stocks in the US, Europe and Japan, and 20% in smaller markets. Only stocks with a minimum market capitalisation of $1 billion are included. Portfolios rebalance monthly and transactions incur 10 basis points of costs. Please see our Factor Guide for the factor definitions.
FACTOR OLYMPICS: GLOBAL
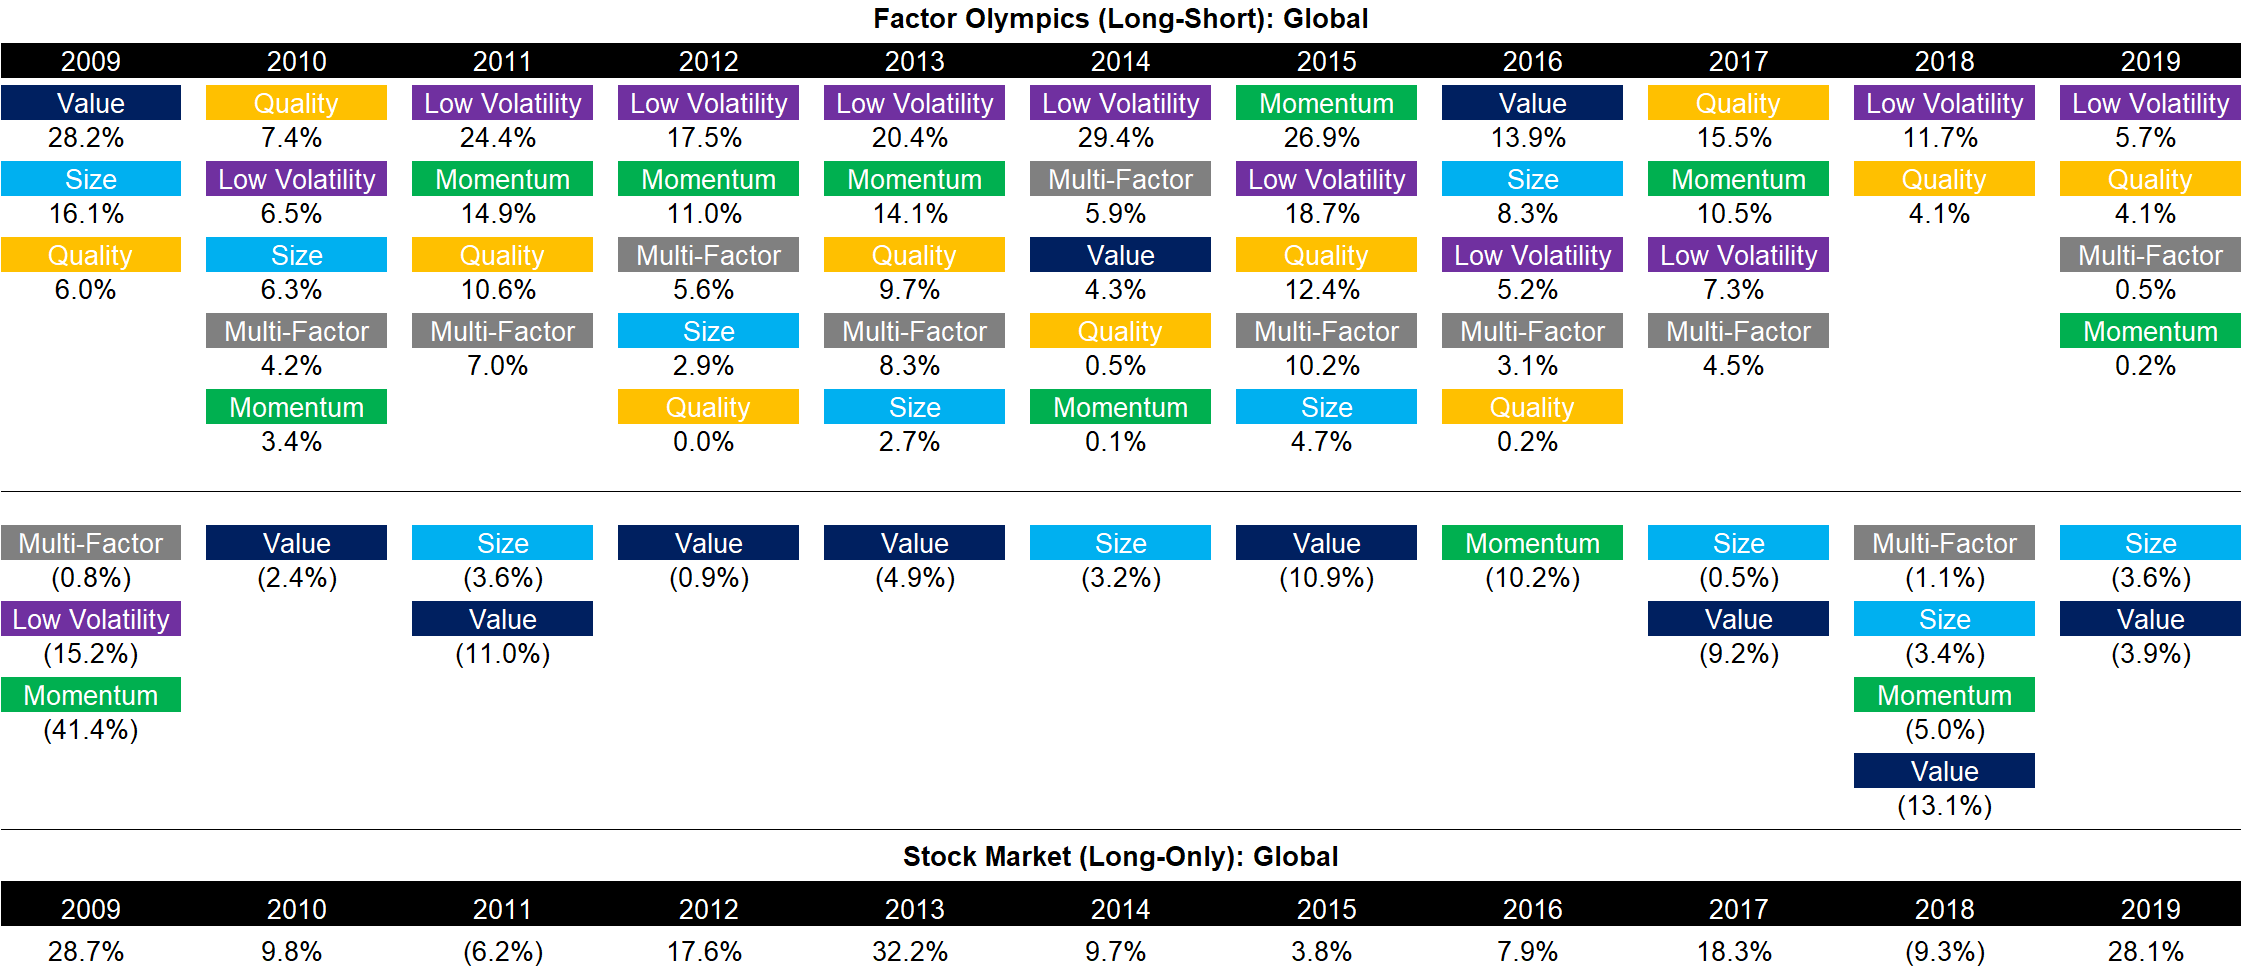
The table below shows the long-short factor performance for the last 10 years ranked top to bottom. The global series is comprised of all developed markets in Asia, Europe, and the US. Aside from displaying the factor performance, the analysis highlights the significant factor rotation in terms of profitability from one year to the next.
The performance leadership is similar to the last decade with the Low Volatility and Quality factors exhibiting the highest returns, albeit less extreme in magnitude than in previous years. Value continued to generate negative returns and the performance accumulates to what can be considered a lost decade for investors focused on buying cheap and selling expensive stocks.
Source: FactorResearch
FACTOR PERFORMANCE 2019: GLOBAL
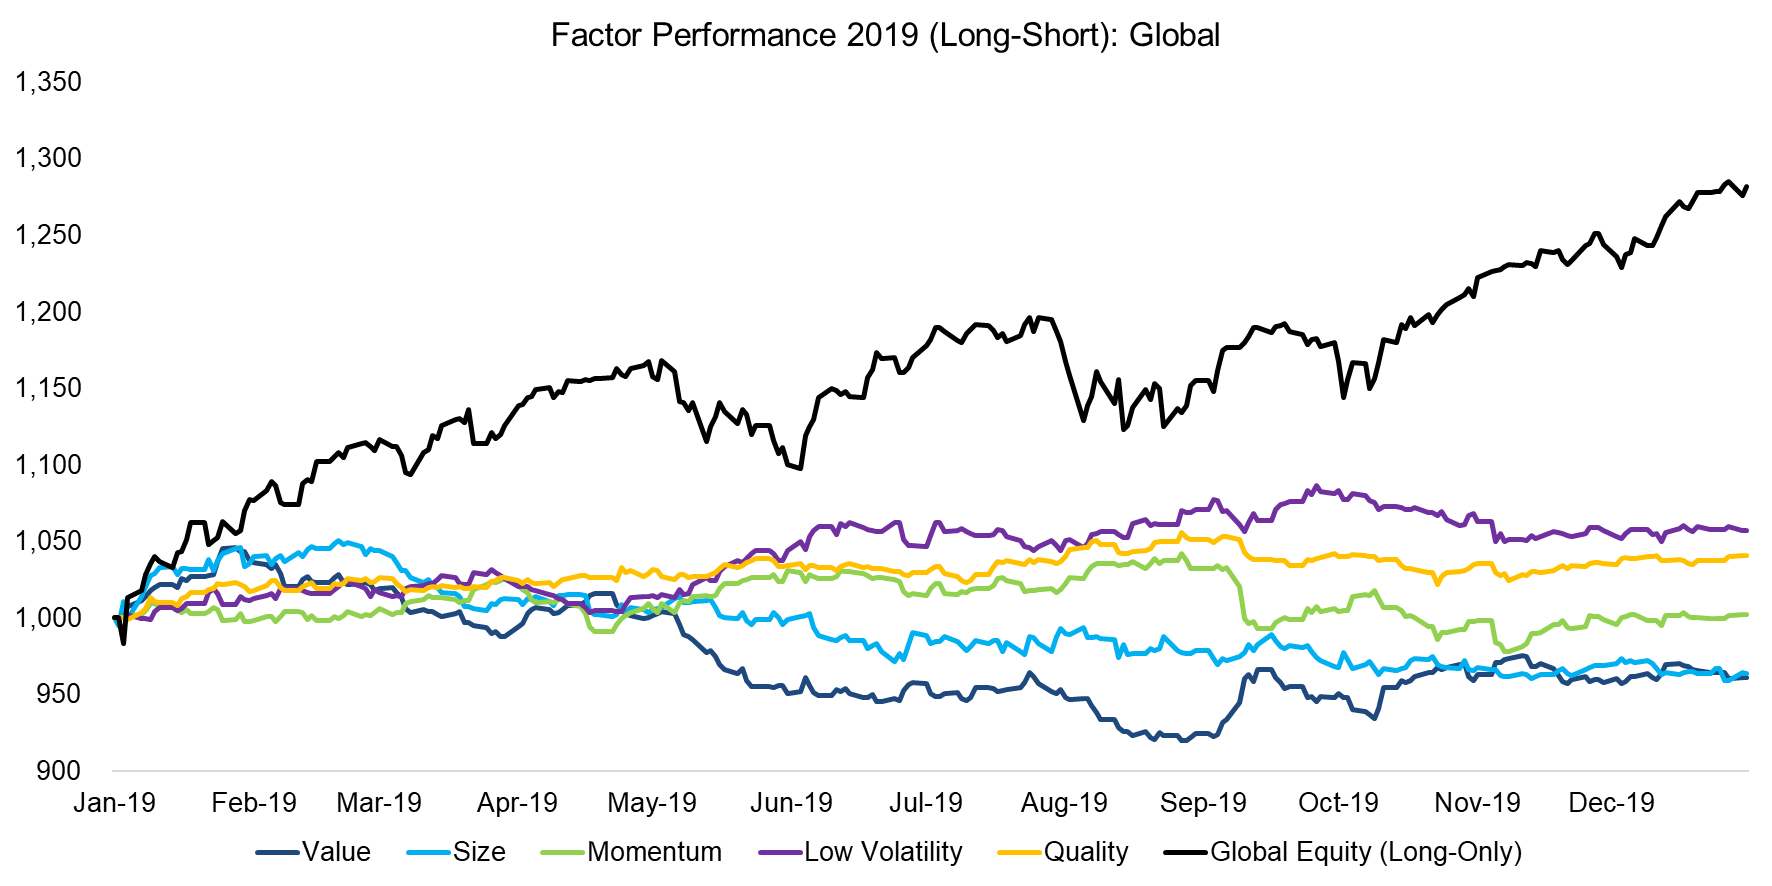
Equity markets generated exceptionally strong positive returns in 2019 and investors have upgraded their global growth expectations and downgraded recessions probabilities in the last quarter. Interest rates remain low globally, mirroring low levels of inflation.
Some thoughts on the performance of the global long-short factors:
- Value & Low Volatility: There is no structural relationship between these two factors from a historical perspective, but in 2019 these behaved liked polar opposites, which was especially apparent from May onward, where Low Volatility generated strongly positive and Value significantly negative returns.
- There was a significant rotation from Momentum, Quality, and Low Volatility into Value in September 2019, but this was short-lived and no structural shift in the trend of the Value factor performance seems to have occurred.
Source: FactorResearch
FACTOR PERFORMANCE 2019: US
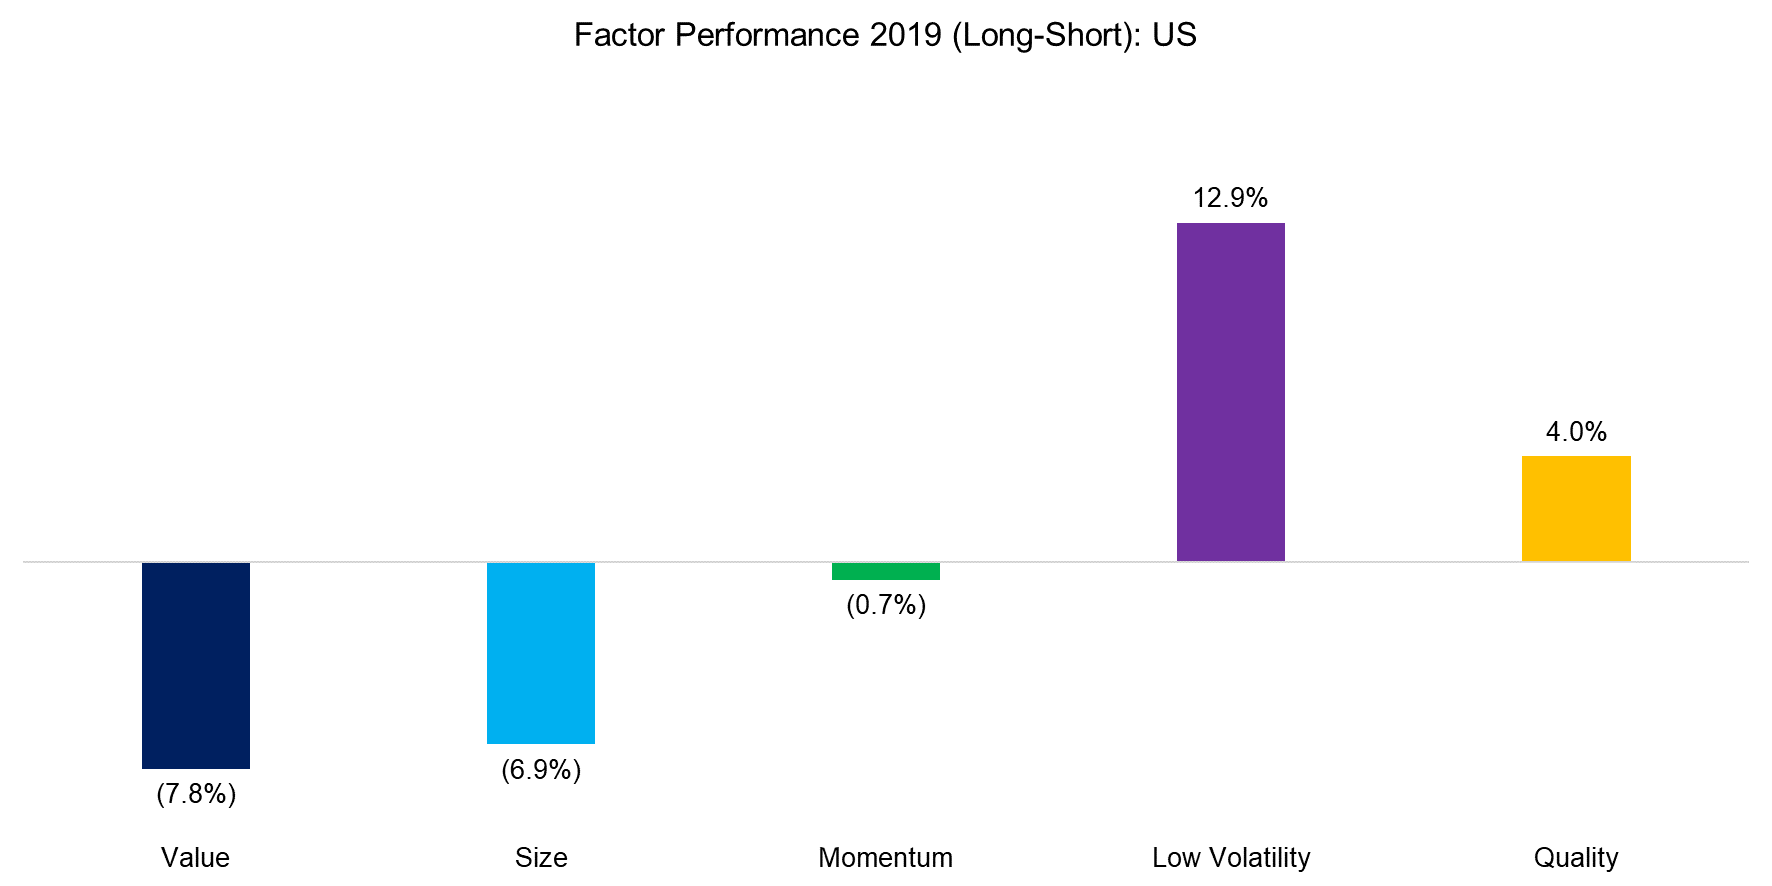
The global performance is significantly weighted towards the US, so it is not surprising that factor performance in the US is alike to the global returns.
The factor performance in the US is led by Low Volatility, which can be partially explained by the interest rate sensitivity of the factor. The 10-year US government bond yield declined from 2.66% in January 2019 to 1.60% in September and most of the positive factor performance was generated during this period. The interest rate since then increased to 1.92% at the end of the year, which led to a decline and flattening of the factor performance.
Source: FactorResearch
FACTOR PERFORMANCE 2019: EUROPE
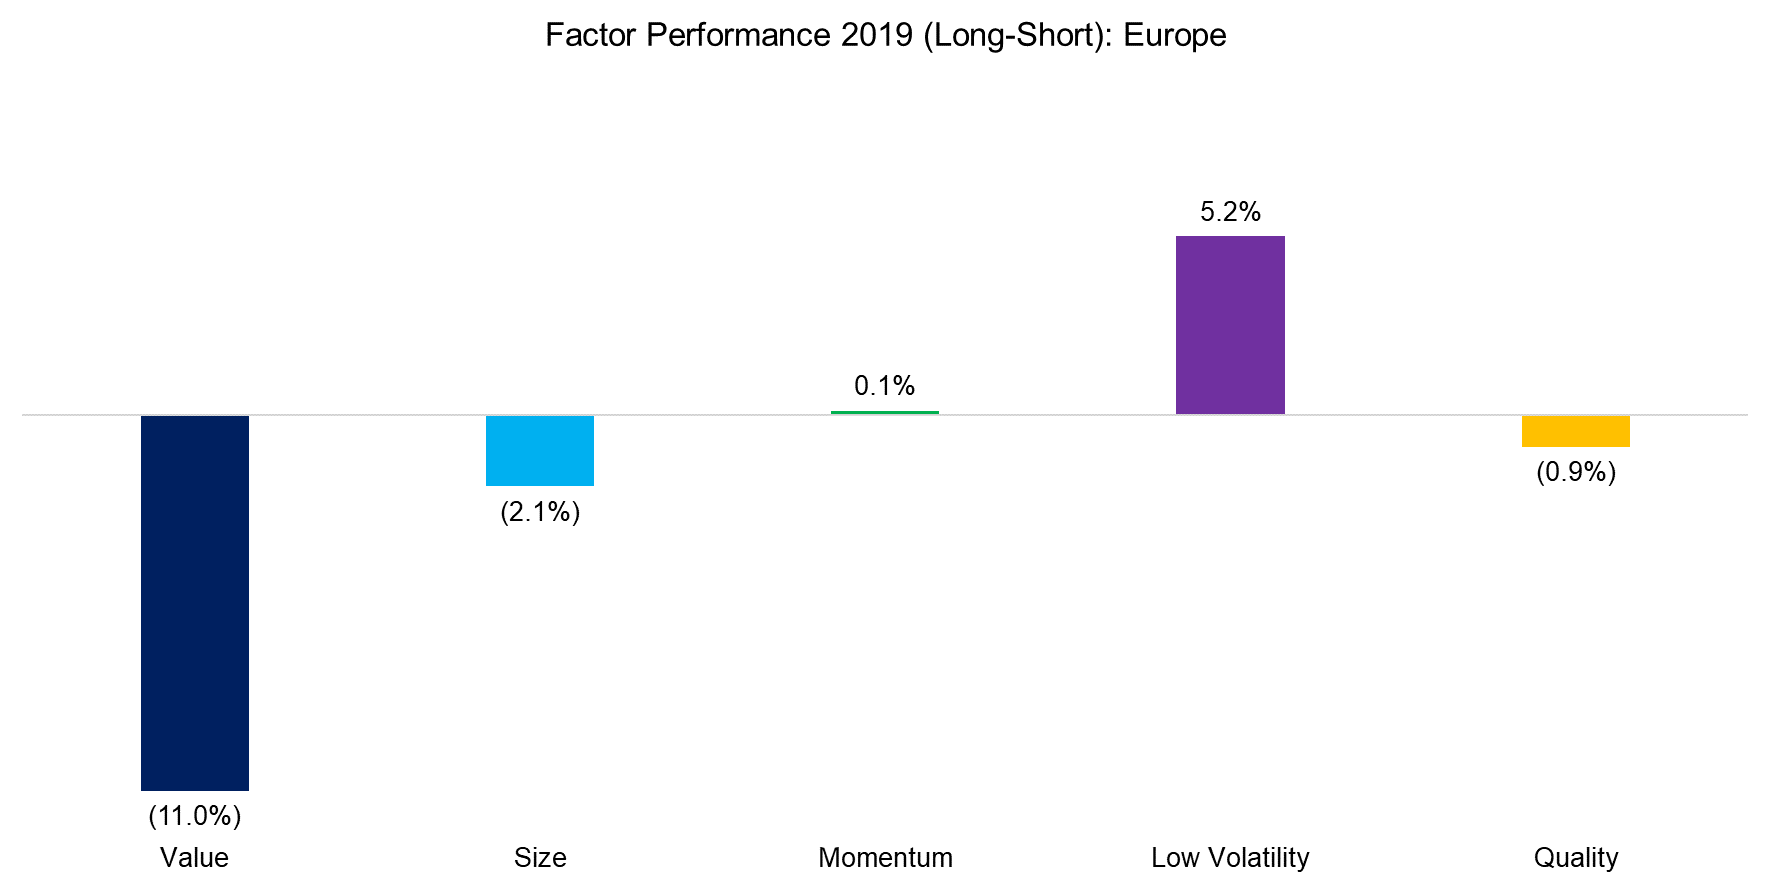
The factor performance in Europe is similar to the US in the direction of returns, which highlights that factors have the same performance drivers across markets. The only difference is the performance of the Quality factor, which was positive in the US while negative in Europe. The Quality factor has a bias towards technology stocks in the long portfolio as many of these are highly profitable and feature low levels of debt. In 2019, the technology sector outperformed the market as highlighted by the almost 40% return of the Nasdaq, compared with 31% for the S&P 500. However, there are far fewer technology stocks in Europe than in the US, which results in different portfolios and partially explains the divergent factor performance between the regions.
Source: FactorResearch
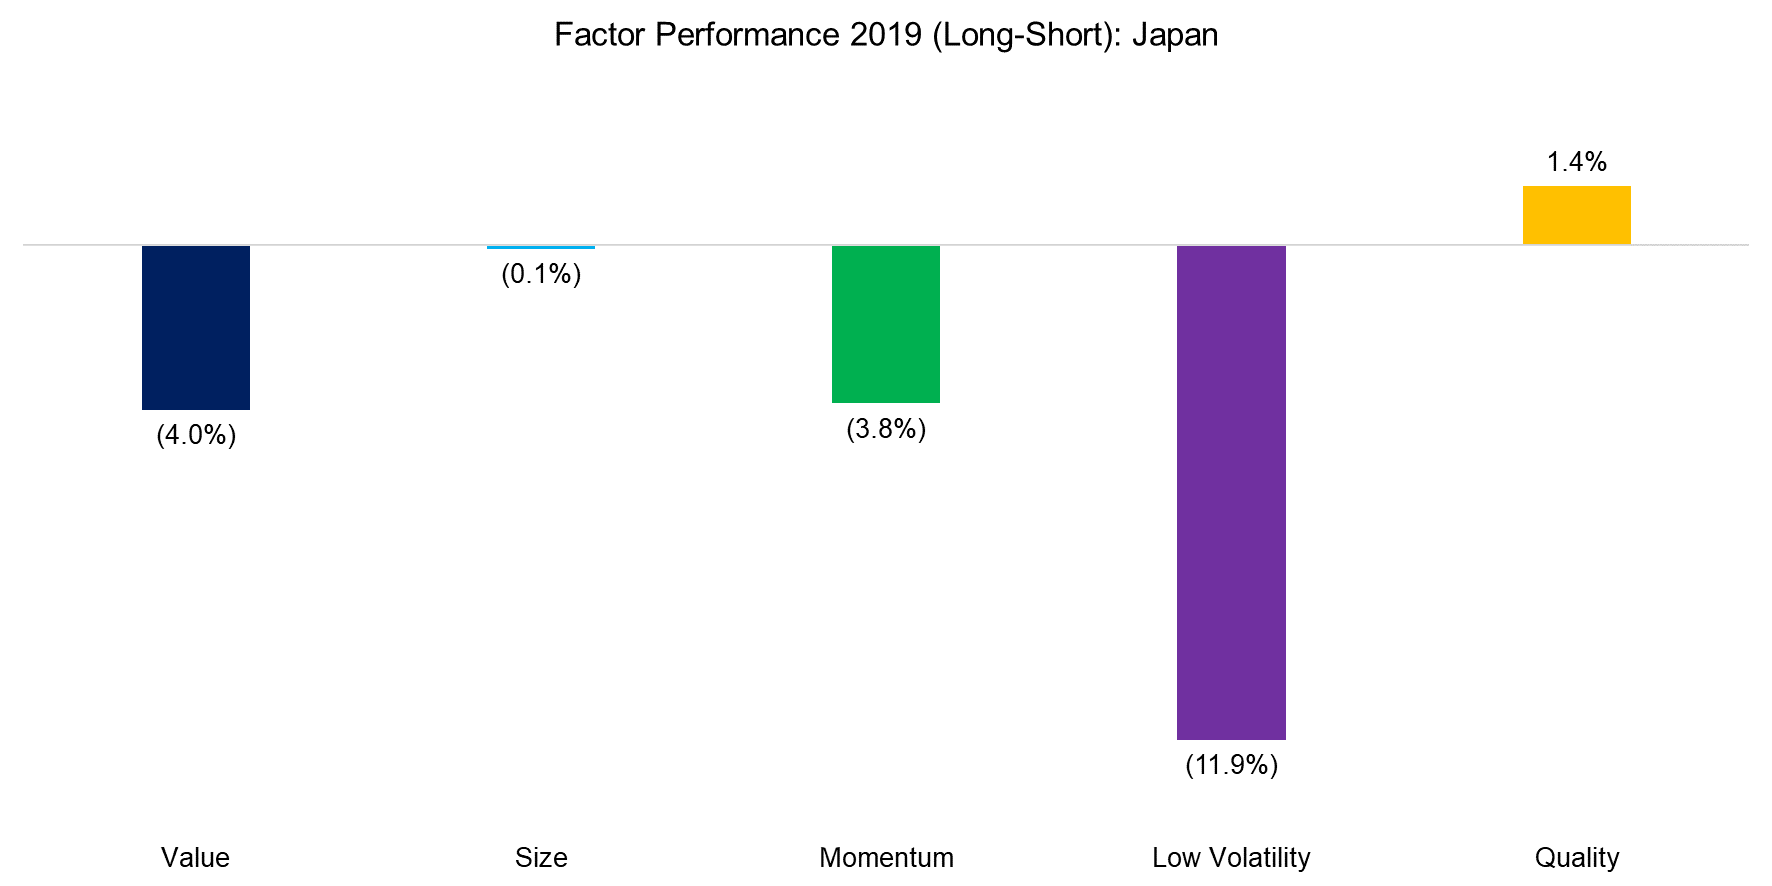
FACTOR PERFORMANCE 2019: JAPAN
The long-term returns of common equity factors in the Japanese stock market have been lower than globally, but the trends in performance were typically the same, e.g. Value in Japan mirrors Value globally.
We observe that Value and Size were negative in Japan, similar to the US and Europe. However, the performance of the Low Volatility factor was strongly negative in Japan while positive globally, which perhaps reflects that Japanese bond yields have reached zero decades ago and provide less tailwind for low-risk stocks than in other markets.
Source: FactorResearch
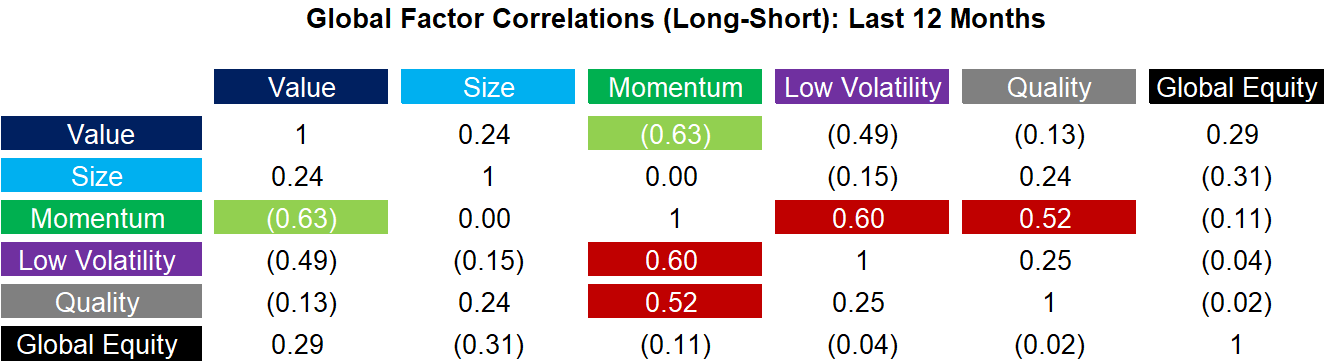
FACTOR CORRELATIONS
The correlation matrix below highlights the global one-year factor correlations based on daily data. As of the end of the year, these are showing risks and opportunities for multi-factor portfolios. Specifically, we observe that Momentum was highly correlated to the Low Volatility and Quality factors while being negatively correlated to Value. Naturally investors can and should consider these relationships when constructing or investing in multi-factor products.
Source: FactorResearch
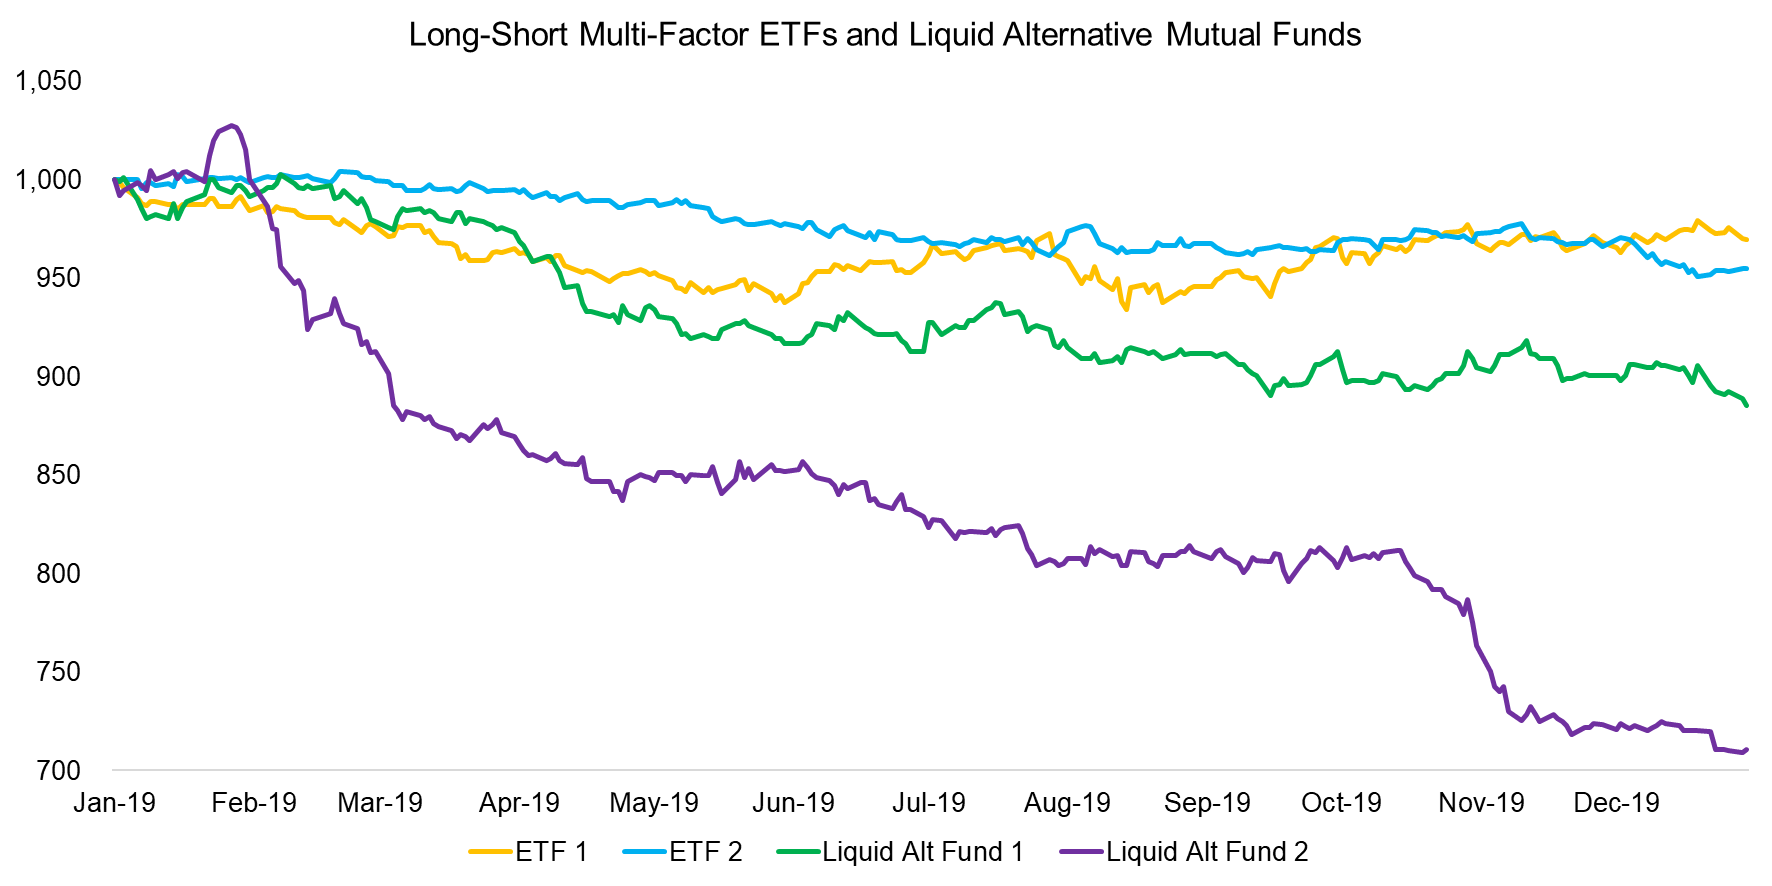
LONG-SHORT MULTI-FACTOR PRODUCTS
Finally, we analyse the performance of long-short multi-factor ETFs and liquid alternative mutual funds in the US and Europe. We observe that all four products generated negative returns for investors, especially the two liquid alternative funds. The performance of a theoretical global long-short multi-factor portfolio would have been barely positive before costs and negative after fees in 2019, so theory and reality reconcile.
Source: FactorResearch
FURTHER THOUGHTS
The trend towards factor investing is intact as seen from the perspective of the assets under management in long-only smart beta products, which are at an all-time high. However, many of the long-short strategies have lost more than half of their assets given poor returns.
Although long-only and long-short factor portfolios are structurally different, the performance is naturally related, which makes these divergent fund flows rather curious.
RELATED RESEARCH
How to Evaluate Smart Beta ETFs
Improving the Odds of Value: II
How Painful Can Factor Investing Get?
ABOUT THE AUTHOR
Nicolas Rabener is the Managing Director of FactorResearch, which provides quantitative solutions for factor investing. Previously he founded Jackdaw Capital, an award-winning quantitative investment manager focused on equity market neutral strategies. Before that Nicolas worked at GIC (Government of Singapore Investment Corporation) in London focused on real estate investments across the capital structure. He started his career working in investment banking at Citigroup in London and New York. Nicolas holds a Master of Finance from HHL Leipzig Graduate School of Management, is a CAIA charter holder, and enjoys endurance sports (100km Ultramarathon, Mont Blanc, Mount Kilimanjaro).
Article by Factor Research

