
As part of Merk’s in-house research we regularly evaluate a consistent set of charts covering the economy, equities, fixed income, commodities and currencies. The aim is to keep our eyes open and to look through the noise of the headlines, avoiding the distractions of sensationalized click-bait. In sharing this content, we offer a cross-check to your own thinking and aim to add value to your own process.
[timeless]
Q1 hedge fund letters, conference, scoops etc
We invite you to download a copy of the slide deck (PDF); or to view the video:
Fed Chart Book
Fed’s Dual Mandate
Established Objectives of Federal Reserve Monetary Policy:
Stable Prices (“Price Stability”): 2 percent inflation rate as measured by the annual change in the price index for personal consumption expenditures (PCE). The Powell Fed views the core (excluding food and energy) PCE as a better indication of future inflation. It is worth noting that the Fed interprets the inflation objective as symmetric, meaning they are trying to prevent persistent deviations, either above or below, from their 2 percent inflation target.
Maximum Employment: The highest utilization of labor resources that is sustainable over time (often estimated as the “natural rate of unemployment” or the “non-accelerating inflation rate of unemployment” (NAIRU)). As Powell likes to point out, the unemployment rate that is consistent with maximum employment is largely determined by nonmonetary factors (i.e., not heavily influenced by Fed policy). The Fed has no fixed goal for this rate, the current longer run estimate for unemployment is 4.5%, from the March 2018 Fed Summary of Economic Projections
Fed Policy Tools


Federal Funds Rate: the primary policy tool of the Fed, it is the overnight benchmark interest rate. The Powell Fed aims for this rate to be at the estimated normal longer-run level when the policy objectives are met (i.e., inflation is running at the target rate of 2% and the economy is operating at maximum employment)
Fed Balance Sheet: Quantitative Easing (“QE”) is Fed balance sheet expansion via bond purchases using “printed money,” Quantitative Tightening (“QT”) is essentially the opposite: Fed balance sheet contraction via allowing bonds to mature without reinvesting the proceeds.
Forward Guidance: a commitment to hold rates at a certain level (e.g., zero) over a certain period of time
Fed Key Concepts
Data Dependency: The Fed describes its policy making process as data dependent, which might be best summarized by Chair Powell’s words: “Our views about appropriate monetary policy in the months and years ahead will be informed by incoming economic data and the evolving outlook. If the outlook changes, so too will monetary policy.” Many of the following charts represent the relevant data followed by the Fed, and specifically by Chair Powell.
Fed Estimate of Normal Longer-run Rate
The summary of economic projections from the March 2018 Fed meeting show a median longer-run projection of 3.00%
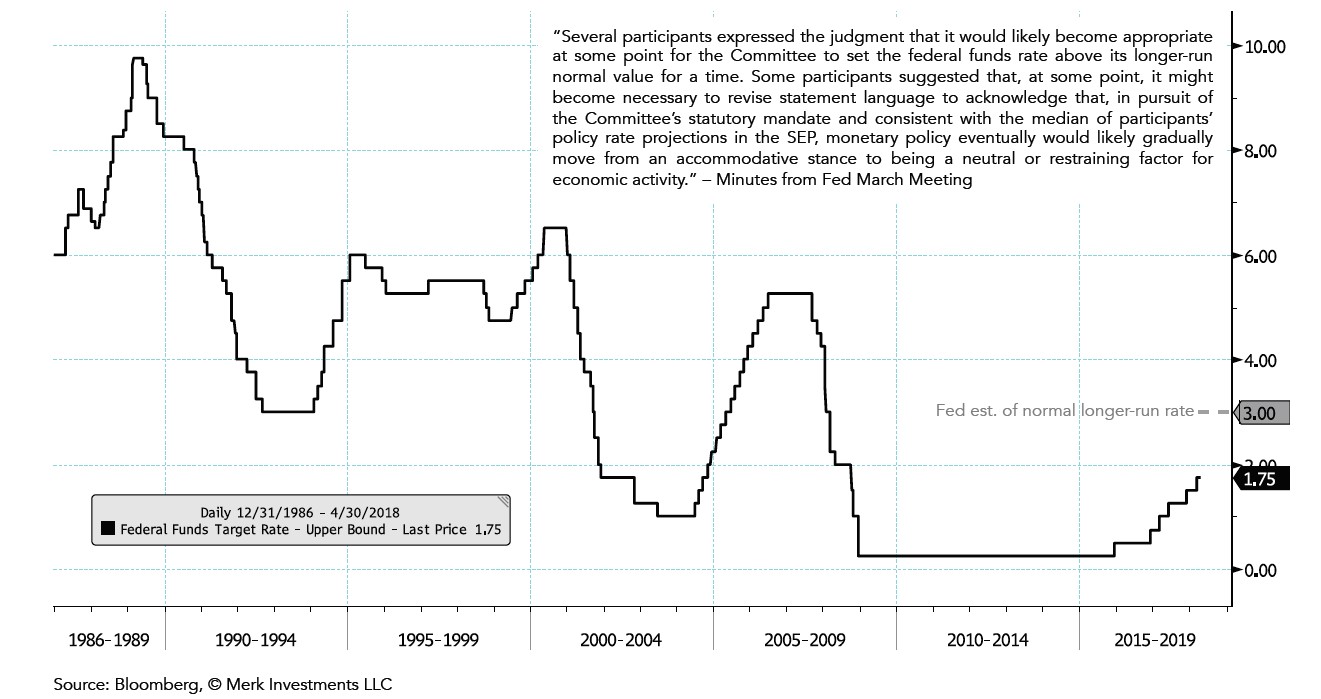
Analysis: Powell views the current gradual rate hikes as a process of removing accommodation, not as tightening per se. If the Fed were to hike rates to what they determine to be the normal longer run rate (currently estimated at 3.00%), that would represent a neutral monetary policy, and anything above the normal longer-run rate estimate would represent restrictive monetary policy. Powell’s view is that gradually reducing monetary policy accommodation will sustain a strong labor market (consistent with the maximum employment mandate) while fostering a return of inflation to 2 percent on a sustained basis (consistent with the price stability mandate). Gradual seems to mean about three 25 basis point rate hikes per year, dependent on the incoming data continuing to suggest that inflation is trending up and the labor market remains strong.
Market Expectations of Fed Funds Rate in 1 year
What’s Priced-in based on the +1-year Fed Funds Futures contract
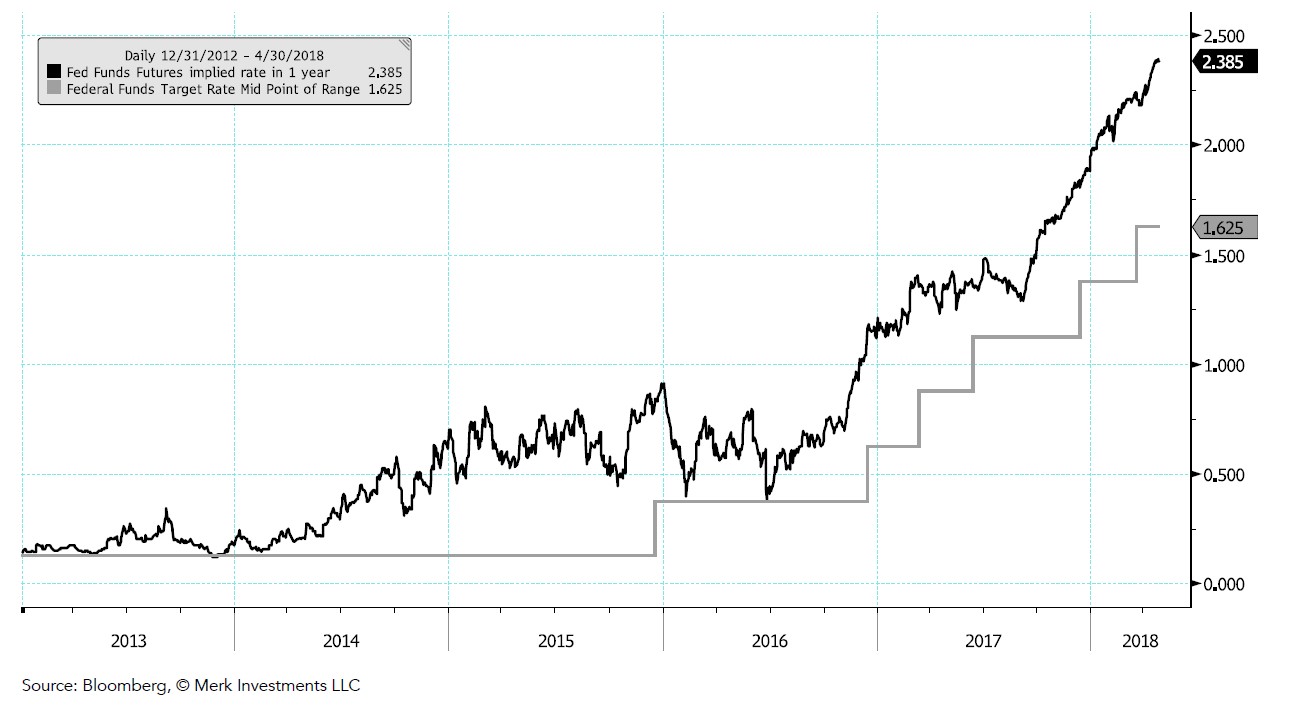
Analysis: The market is pricing the Federal Funds rate in 1 years time at 2.39% (Fed funds futures are priced on the effective rate which is between the upper and lower bounds of the target range, the current Fed funds target midpoint is at 1.625% (between 1.50 and 1.75))
Inflation Readings
The Headline and Core (excluding volatile food and energy prices) Personal Consumption Expenditures Index YoY Seasonally Adjusted (SA)
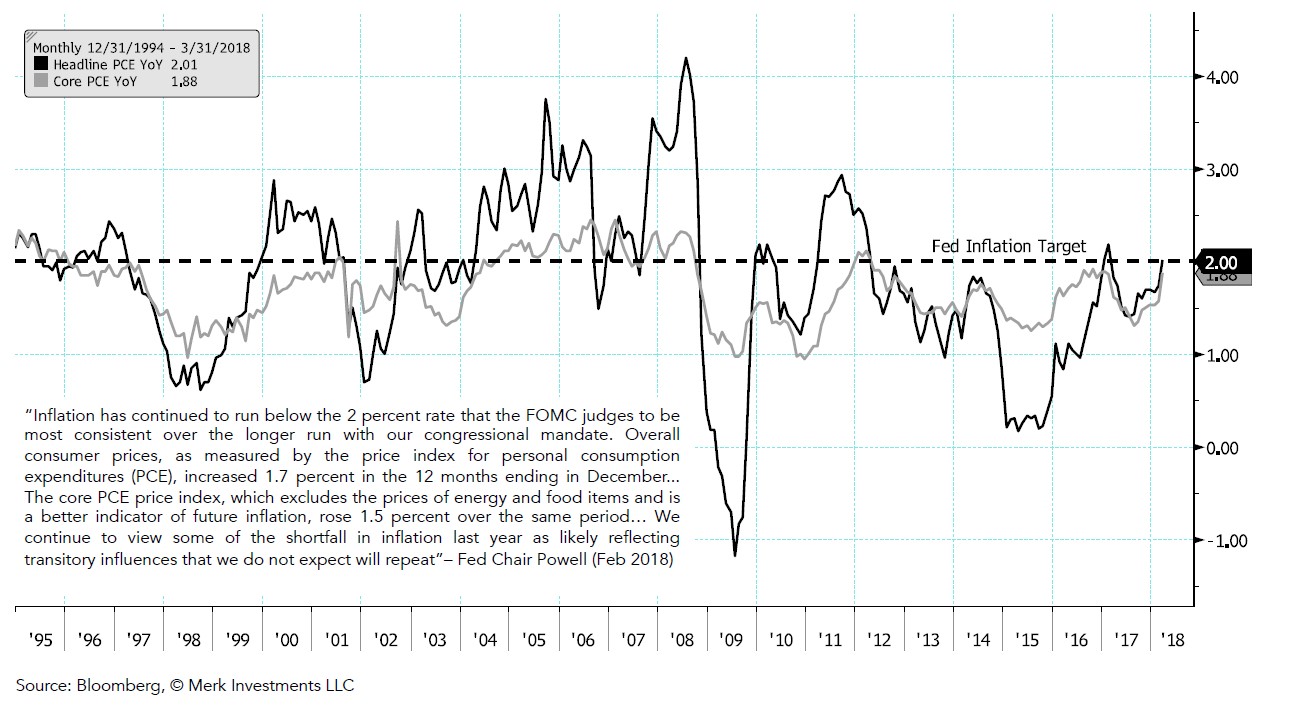
Analysis: The Fed expects PCE YoY to run at around 2% in 2019 and 2020 according to the Fed’s latest Summary of Economic Projections. The March PCE data shows the headline inflation rate at target of 2% *This chart relates to the price stability mandate*
Inflation Expectations
10-year “breakeven” basically means the inflation rate that is implied by 10 year Treasury Inflation Protected Securities (TIPS)
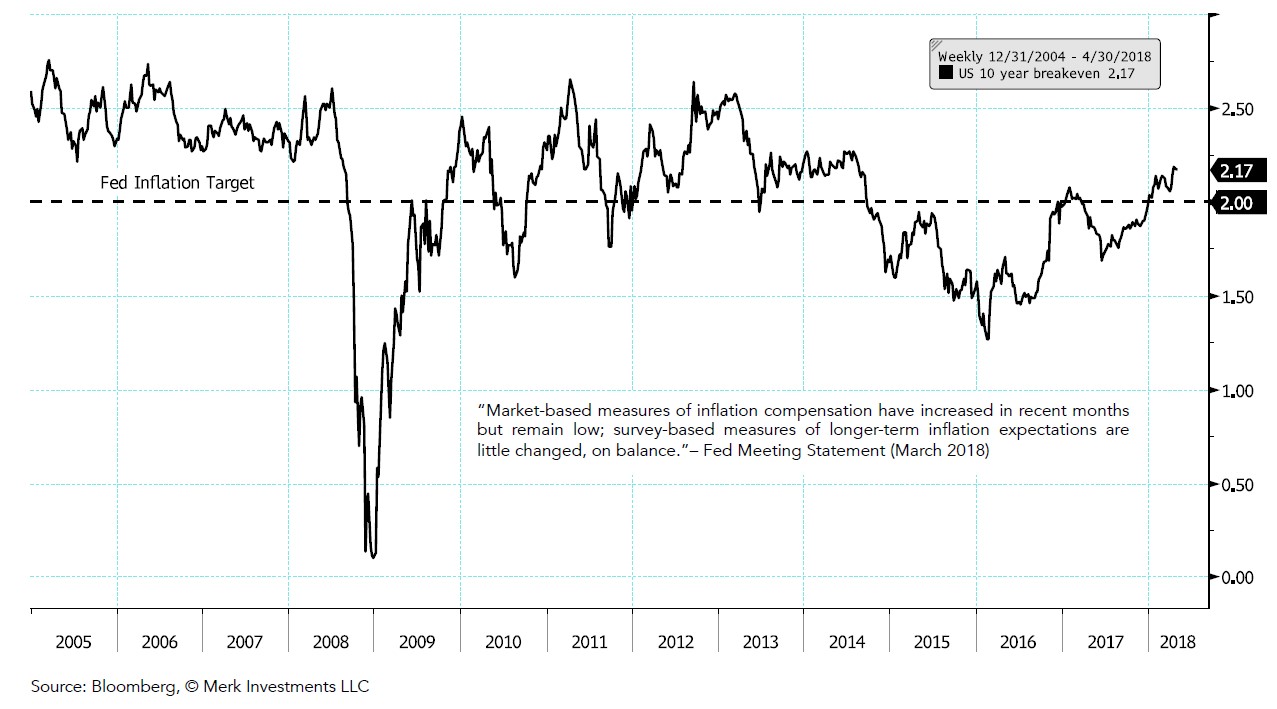
Analysis: The market is suggesting average annual inflation over the next 10 years might be around 2.17%, based on the TIPS. This is considered a market-based measure, the Fed also looks at other market-based measures as well as survey-based measures. *This chart relates to the price stability mandate*
Unemployment Rate and Wages

The relationship between the unemployment rate and wages is referred to as the “Phillips Curve”
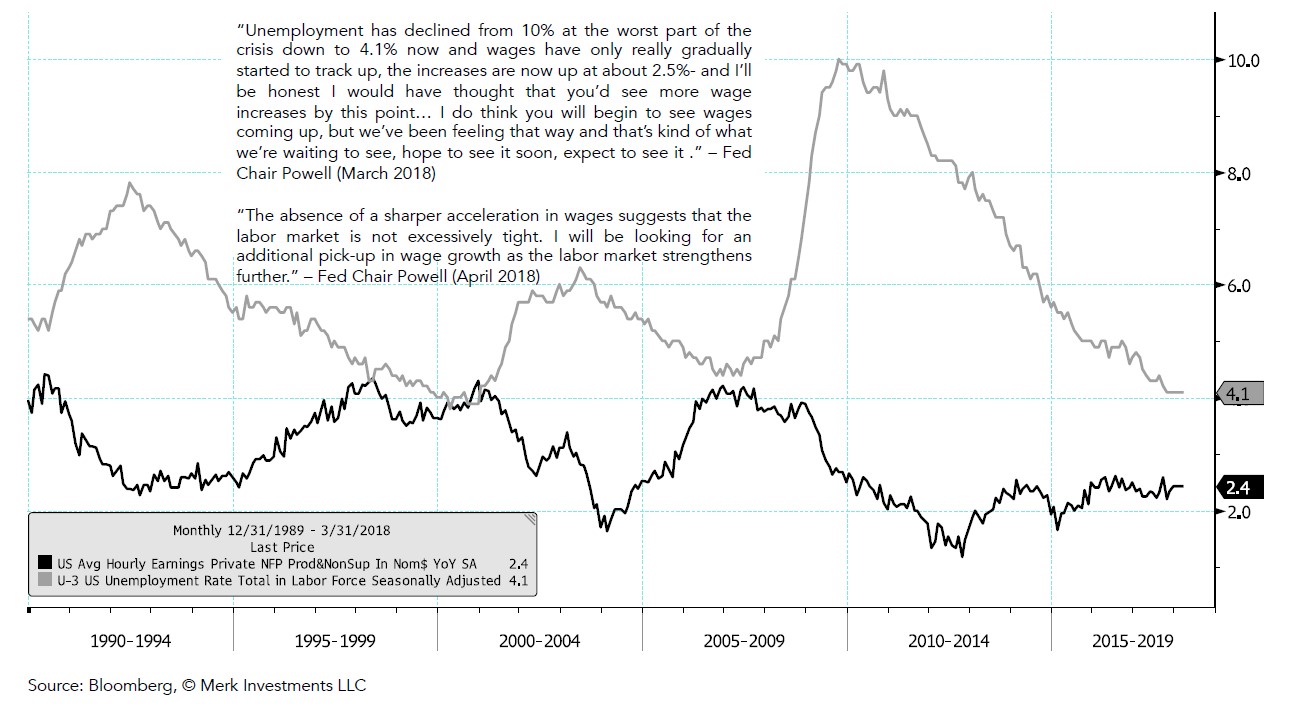
Analysis: Fed policy makers have been surprised by the lack of wage inflation (and general inflation) in recent years I think in Powell’s mind that suggests the labor market might not be at maximum employment yet. *This chart relates to both the price stability mandate and the maximum employment mandate*
The investing audience should view this content in the context of their individual investment process, time-horizon, and goals.
| Publication Date | Chart Book Category | HTML | VIDEO | |
| May 2, 2018 | Fed Chart Book |  |
||
| April 19, 2018 | U.S. Equity Market | |
||
| April 10, 2018 | Business Cycle | |
||
| March 21, 2018 | U.S. Equity Market | |
||
| March 14, 2018 | Business Cycle | |
||
| February 14, 2018 | U.S. Equity Market | |
||
| February 7, 2018 | Business Cycle | |
||
| January 17, 2018 | U.S. Equity Market | |||
| January 10, 2018 | Business Cycle | |||
| December 12, 2017 | Business Cycle |
Article by Axel Merk, Merk Investments

