
This is the seventh of a 10-part blog series where I will go through each of the charts from the 10 Charts to Watch in 2019. The purpose is to add some extra comments and context around the charts, as well as to explain some of the finer details of the indicators.
Q4 hedge fund letters, conference, scoops etc
This time we look at the path of US high yield credit spreads and the Fed funds rate. Astute observers (and those with good eyesight) will notice the chart has a 3rd (grey) line. This is the shadow Fed funds rate, which takes account of the impact of quantitative easing (and its subsequent removal). Take note, this is important…
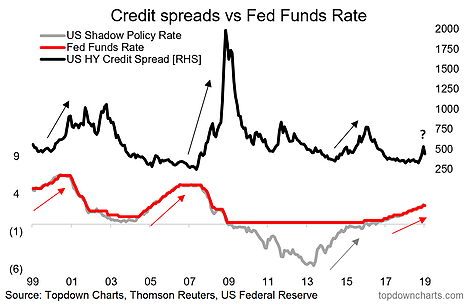
The key takeaway from the chart, as highlighted with the sets of arrows is that the typical pattern following a Fed rate hiking cycle is that credit spreads ultimately head wider, and sometimes catastrophically so.
As I noted in the original post:
“Higher cash rates may cause issues for those who opted to push risk for income: US high yield credit is in the final innings; anticipate wider spreads ahead.”
Back to that shadow rate, you can see how I have attributed the 15/16 blowout in credit spreads to the shadow tightening that took place (really very substantial when you notice how it went from almost -6% to almost 0%).
It’s probably fair to count the actual rate hikes that recommenced in Dec-16 as an entirely new hiking cycle, and thus here we are today, well progressed down the road of policy normalization, and credit has certainly started to stir. Although spreads are up from rock bottom (i.e. very expensive valuations), we continue to hold a bearish bias as more “orange lights” and “red lights” are starting to appear. The credit risk premium remains inadequate.
But we still need to be focused on the data, and two key upcoming releases I will be watching closely are the CMI (credit managers index) next week, and the Fed loan officer survey (or SLOOS) the week after. These will help shed important light on how the whole credit system is faring and whether the people on the front line of the banking system are tightening up and how they are seeing loan demand. So stay tuned for that update.
In the mean time, as I’ve said before, at this stage in the cycle the burden of proof to own credit is higher than usual, and it will pay to think twice before pushing out the risk curve for the sake of hitting income targets. Indeed, the other thing about rate hikes, aside from bringing us closer to the end of the cycle, is that they make cash incrementally more attractive with each passing hike. So, don’t obsess about it, but certainly keep watching those rate hikes…
For more and deeper insights on global economics and asset allocation, and plenty of good charts you may want to subscribe to our institutional research service.
Click through for free look or a trial…
Article by Top Down Charts

