
Implementation and flexibility. You need to implement a trade in a way that limits your losses when you are wrong, and you also need to be able to recognize when a trade is wrong. George Soros has the least regret of anyone I have ever met. Even though he will sometimes play up to his public image as a guru who knows what is going on, it is in no sense what he does as a money manager. He has no emotional attachment to an idea. When a trade is wrong, he will just cut it, move on, and do something else. ~ Colm O’Shea via “Hedge Fund Market Wizards” by Jack Schwager
Q3 2022 hedge fund letters, conferences and more

In this week’s Dirty Dozen [CHART PACK], we talk lagging monetary policy, sucking liquidity, slowing earnings, and rising market risks. We then go through some monthly charts, and cover the DXY at a major technical point. Some gold miners inflecting higher, and a natty producer coiled for another run higher, plus more…
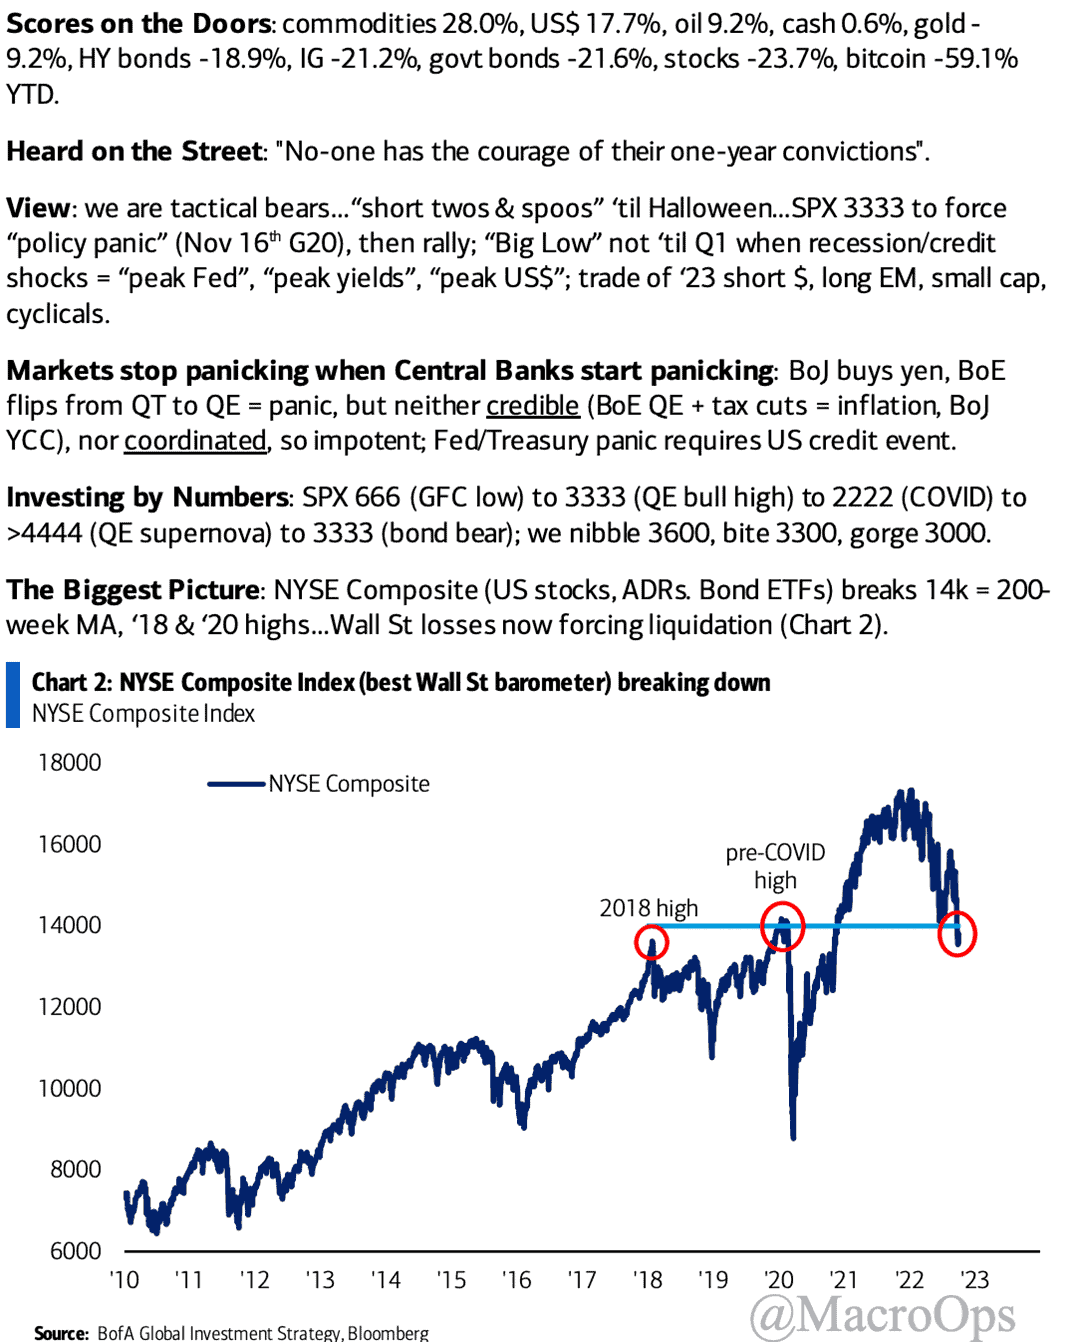
- BofA’s latest Flow Show summary. Their take feels about right to me.
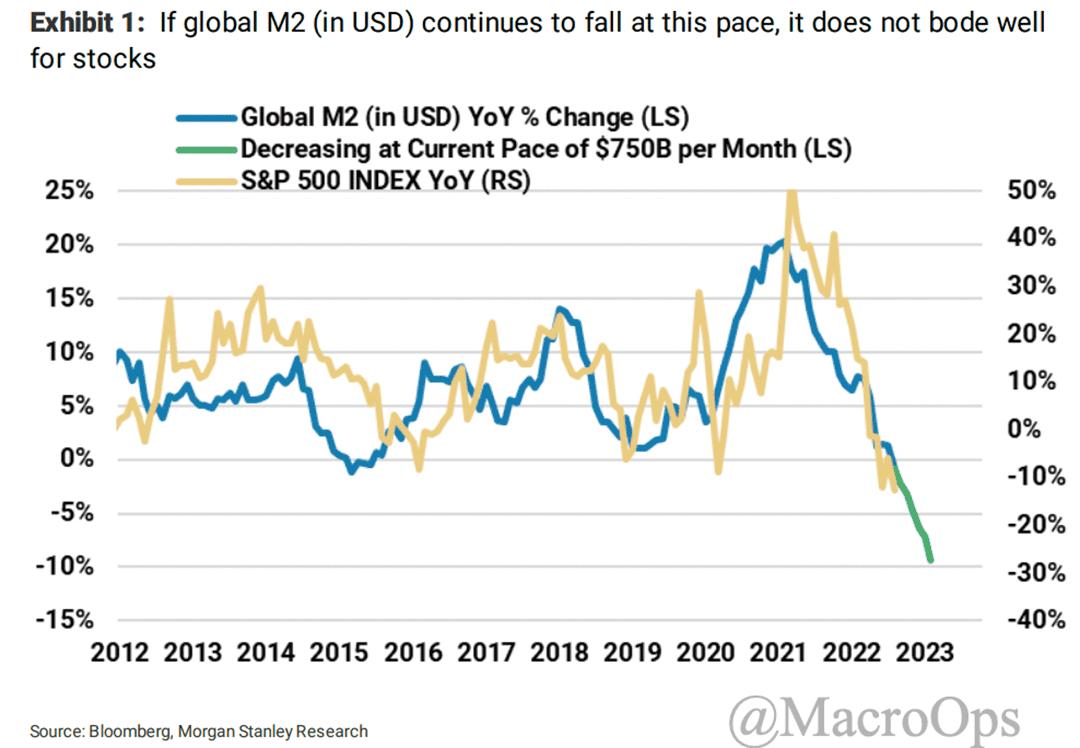
- It’s not rocket science… When the Fed tightens financial conditions too quickly, bad things happen. Here’s a snippet from MS:
“…a Fed pivot is likely at some point given the trajectory of global M2 (in USD). However, the timing is uncertain and won’t change the trajectory of earnings estimates, our primary concern for stocks at this point.
“Bottom line, in the absence of a Fed pivot, stocks are likely headed lower. Conversely, a Fed pivot, or the anticipation of one, can still lead to sharp rallies. Just keep in mind that the light at the end of the tunnel you might see if that happens is actually the freight train of the oncoming earnings recession that the Fed cannot stop.”
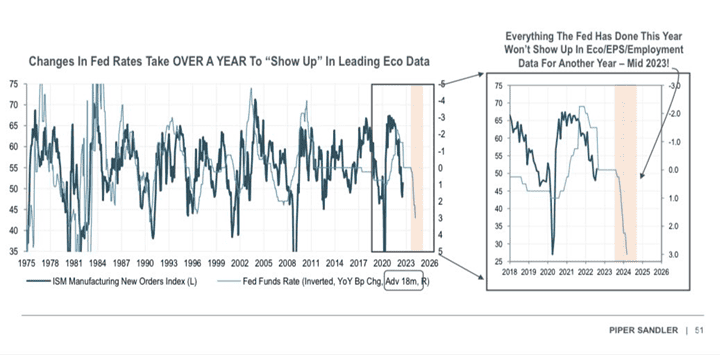
- And since the impacts of monetary policy work with a long lag, it’s nearly impossible for the Fed not to overdo its tightening cycle and basically wreck things (chart via @MichaelKantro)
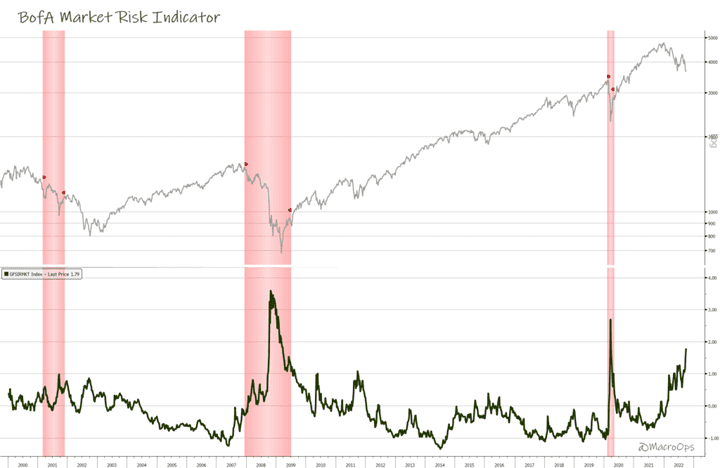
- This all, of course, creates an incredibly risky backdrop for risk assets. BofA’s GFSI Market Risk Indicator (a measure of future price swings implied by option markets in global equities, rates, FX, and commodities) is nearing COVID and GFC highs (a reading above 0 indicates more stress than normal).
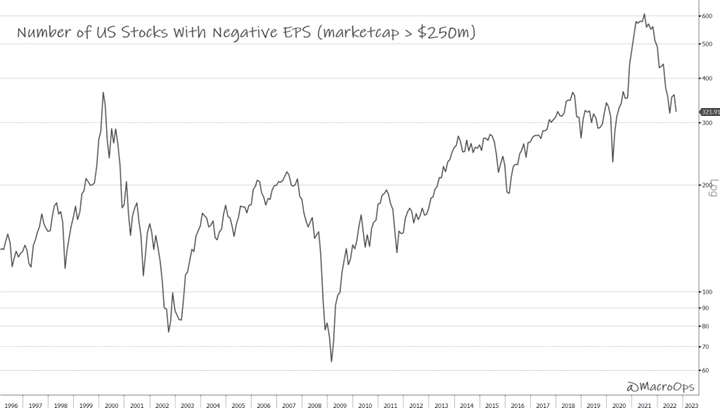
- And seeing as how there are still plenty of overvalued dogs out there, it’s not difficult to bet that the trend down still has a ways to go… This chart shows the number of US stocks with negative earnings (chart via BBG’s MacroMan).
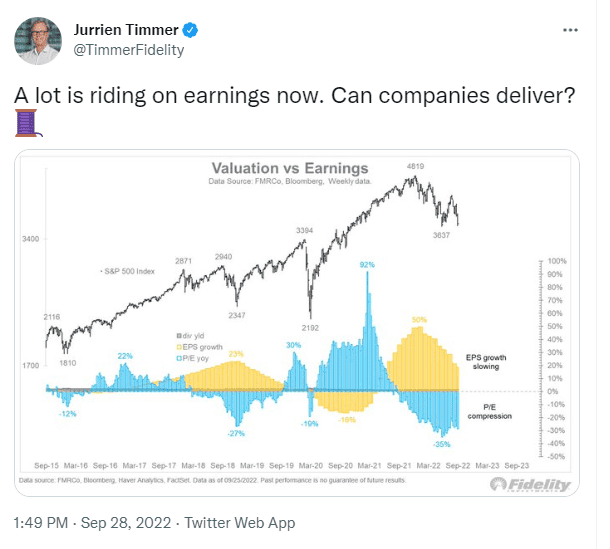
- Like we wrote last week, the selloff to date has been driven by multiple compression due to higher rates. The next leg lower will be driven by an earnings recession. See this thread from @TimmerFidelity.
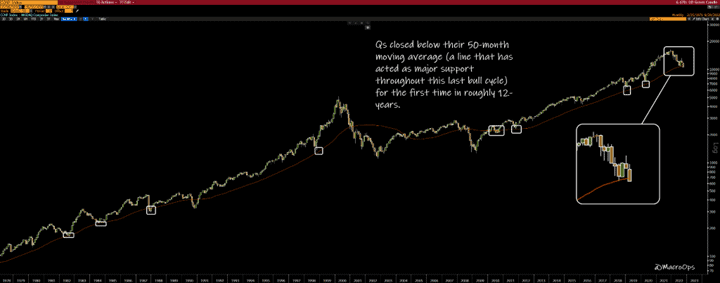
- The Qs closed below their 50-month moving average in September, marking the first monthly close below this magic line since 2010. This is as plain of a sign of regime change as any.
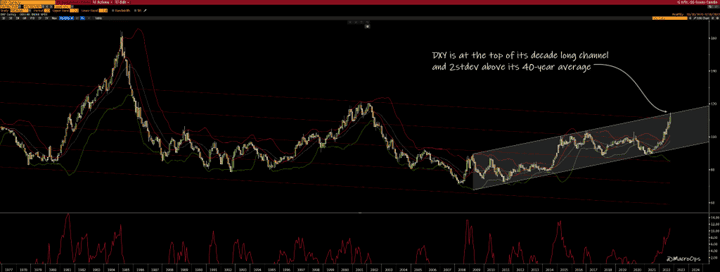
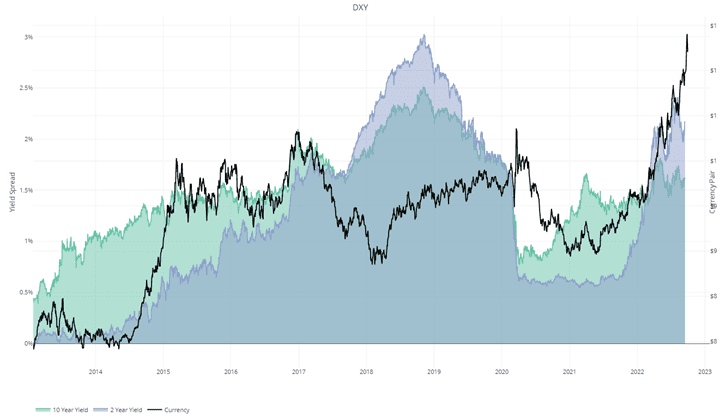
- The USD wrecking ball is front and center lately. Momentum still favors more upside over the near-term, but we’re watching the DXY closely, as it’s driving a lot of global cross-asset moves. It’s also at a major technical point of resistance as it’s banging against the upper bounds of its decade long trading channel and is 2std above its 40-year average.
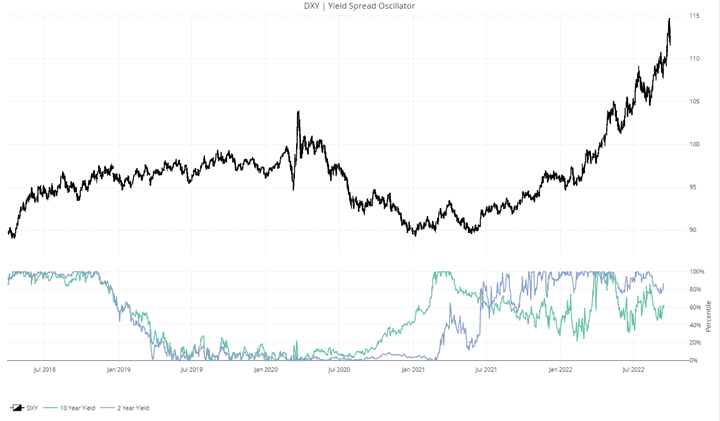
- As always, watch yield spreads. Below are the 2-and10-year yield spreads between the USD and its trade-weighted basket of currencies on both a nominal and a rate-of-change basis (yield spread oscillator). Yields are still roughly supportive of the move, but they’re starting to lose steam.
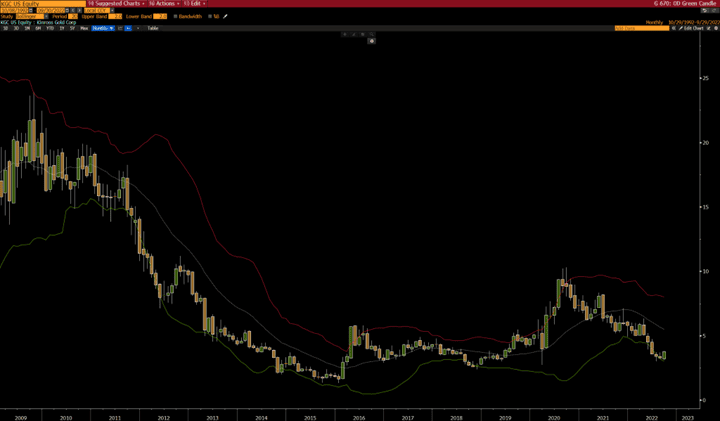
- Over the weekend, I went through hundreds of monthly charts (something I do at the start of each month). Most areas of the market look atrocious (not surprising). But a few bright spots were in precious metals and oil & gas. Kinross Gold (KGC) had a strongly monthly close at its highest last month. This move is made more significant because the bears have tried and failed repeatedly to push the stock below its $3 level over the past two months, which is also at its lower monthly Bollinger Band.
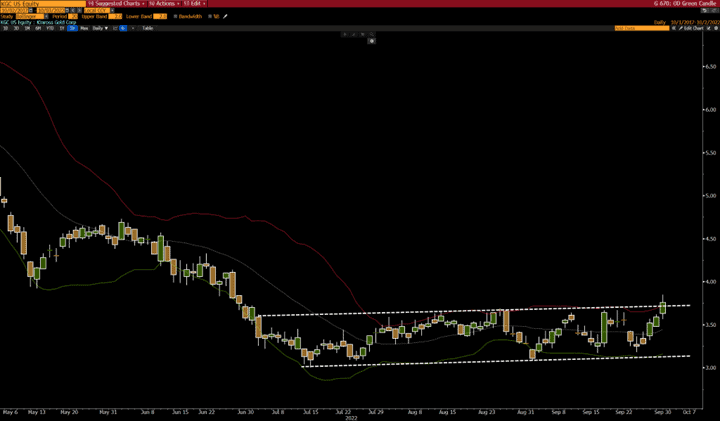
- The daily looks even better with a recent breakout above its 3-month channel. I’d wait for a little more follow-through confirmation, but I like the look of this setup.
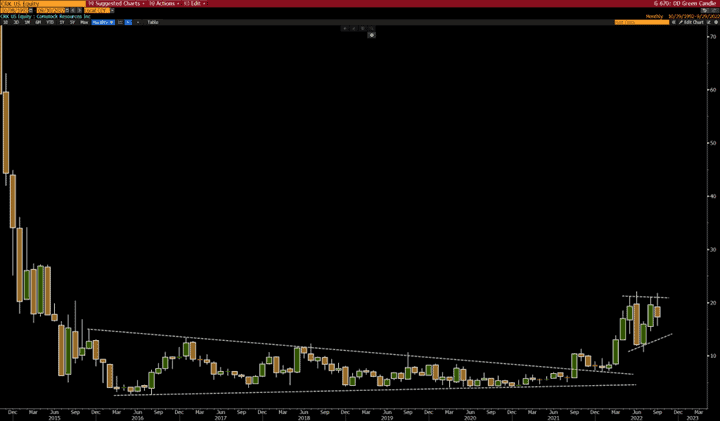
- Finally, it might be time to reload those CRK DOTM calls we bought and sold for a nice profit last year (link here).
Thanks for reading.
Stay frosty and keep your head on a swivel.

