
Portfolio Manager Chuck Royce and Co-CIO Francis Gannon recap the historic 4Q18 downturn and discuss how they’re navigating the current environment.
Q3 hedge fund letters, conference, scoops etc
How did 2018’s fourth quarter stack up historically with other poor quarterly performances for small-caps?
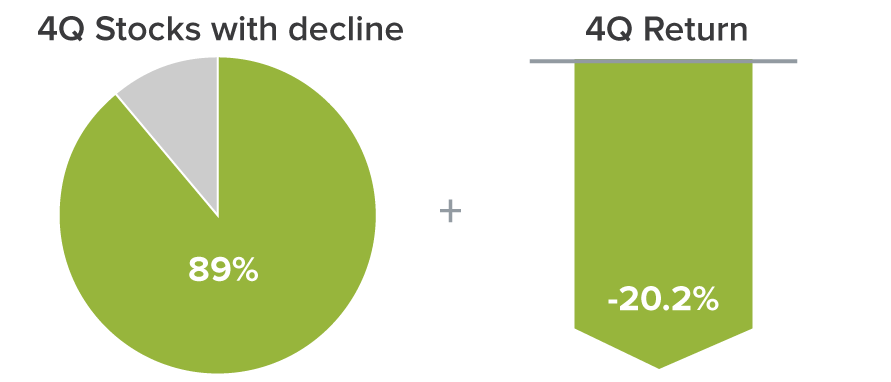
Francis Gannon The Russell 2000 Index declined 20.2% in the fourth quarter, which made it among the broadest and deepest since the inception of the index 40 years ago. Within the index, 89% of the companies had a negative fourth-quarter return. Compare that to 2008’s calamitous fourth quarter, when “only” 87% of the companies finished in the red. Just three other quarters exceeded that 89% figure —the fourth of 1987 and the third quarters of 1990 and 2011. In addition, only six quarters out of 160 since the Russell 2000’s inception had worse results. All that adds up to a historically difficult quarter for small-cap stocks.
Broad and Deep Decline
Russell 2000 Declines in 4Q18
How would you characterize the recent downturn based on the history of small-cap bear markets?
FG We’ve seen some atypical elements. Most pullbacks have not been this violent. And during previous bear phases, such as 2008-09 and 2011, there was an obvious catalyst for the mass sell-offs. The world was dealing with a recession and reeling from the effects of the Financial Crisis in 2008, while in 2011, everyone was still afraid that we’d slide back into recession because the initial economic data that year was underwhelming. Going further back, the small-cap decline in 2001-02 came with a recession, and in 1998 there was the Asian currency crisis.
A Familiar Pattern in 4Q18 Decline
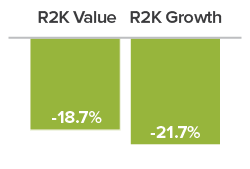
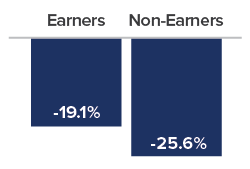
In other ways it felt very familiar—small-cap has been hit harder, for example, which is consistent with many historical bear markets. We’ve also seen value beat growth, dividend payers ahead of non-payers, earners edge non-earners, and defensives so far outpace cyclicals. All of this is pretty consistent with previous significant downturns.
What surprised you most about the downturn?
Chuck Royce I think the speed and severity of the decline struck me most forcefully. Back in August, everyone was talking about the elevated state of valuations. A correction of some sort seemed inevitable to us. But we were anticipating something in the range of maybe 8-15%. As December wore on, however, it was clear that this was a far more severe downturn than we had been expecting. With a little more time to reflect, I suppose it’s not terribly surprising that an uncommonly long bull market, one that also had very low levels of volatility, would end in an abrupt and unexpectedly bearish way—but it felt almost shocking at first.
FG I was surprised that so much of the confidence about the U.S. economy’s strong growth seemed to begin evaporating almost immediately after share prices began to fall. That confidence was replaced in short order by anxieties about the long length of the equity cycle and the perception that U.S. economic growth has peaked, among other concerns. The news of slower growth out of China and Europe, along with ongoing trade war and tariff talk, only exacerbated these fears.
Why do you think the correction was so severe?
CR I suspect some of it was driven by investors taking losses after several years of gains, which may have had a snowball effect, moving prices lower at high speed. I also think that the declines in the last few weeks of December may have been, at least in part, caused by a combination of the government shutdown and the absence of any new positive developments in the economy. This seemed to create more uncertainty than many investors were prepared to handle.
What do you see as the closest historical parallel to 2018?
CR I think it’s important to distinguish where I see parallels and where I don’t as well as to explain why. What I see is based on the fact that at the end of 2018, the U.S. economy looked a lot closer to slower but positive growth than to contraction. Investors often overreact to rates of change. In the current market, it looks as if they’ve taken slowdowns in key indicators like housing and autos and assumed the worst. Now, it’s also true that consumer confidence has moved lower, and some of the regional Federal Reserve outlook surveys are showing a slower pace of growth. So there are definitely reasons to be concerned.
But it seems to me that investors have confused a deceleration in growth with an imminent recession. Too many people are behaving as if the economy runs on only two speeds—peak growth and contraction. Obviously, that’s not the case. Based on the data we’ve seen and—more important—what our conversations and analyses of companies tell us, growth is likely to slow, but remain positive in 2019. So I think 1987 or 1962 are the more relevant historical comparisons—two cases in which the markets fell precipitously before rebounding in the midst of a still-growing economy. I don’t think that we’re in a period such as 1998, 2001-02, 2008-09, or 2011, when there more than enough reasons for investors to sell while contrarians like us, by the way, were trawling for opportunities.
Historical Comparison: 1962 and 1987
CRSP 6-10 Declines and Subsequent 12-Month Performance
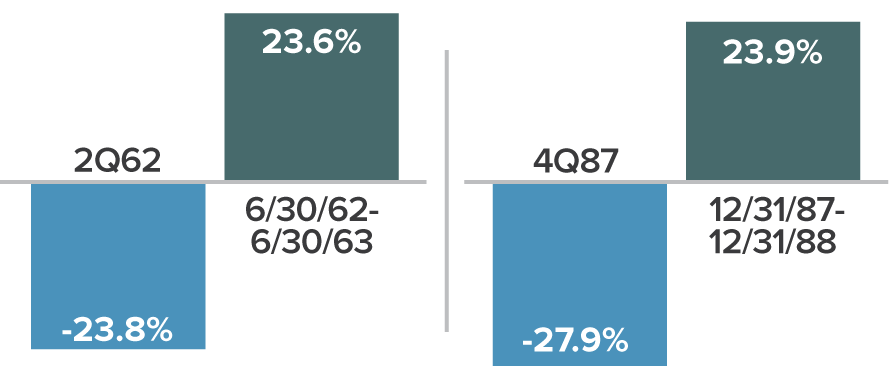
FG We really want to emphasize that the only decline which featured both a recession and a financial crisis was 2008-09. Unless investors expect something like a repeat of that experience, history suggests this may be a good time to commit more money to small-caps. That’s certainly what we’ve been doing.
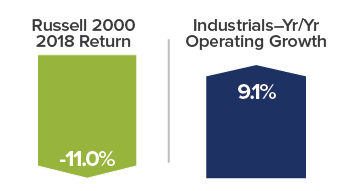
Why do you think the disconnect has persisted between the strong business results and poor stock performance for many cyclicals, especially industrial companies?
CR I think the threat of tariffs and other global trade disruptions raised legitimate concerns for investors that companies involved in industrial activity, particularly global activity and even more specifically activity in China, would struggle. Each cycle is different. I think the difference in the current cycle is that the slowdown in China is having a greater effect on industrial companies than in any previous cycle. This slowdown, along with slower growth in Europe and Japan, seemed to validate many investors’ concerns not just about industrial companies but about energy and materials stocks as well.
What is your perspective on these hard-hit sectors?
CR True to our contrarian nature, we still see a lot of long-term opportunity, especially in light of the decline. It’s also important to us that within these cyclical sectors, especially in the broad industrial space, there are diverse areas with distinct business cycle dynamics. Each group responds to multiple company- or industry-specific factors that help to determine performance as a business—they seldom march in lockstep. That diversity is very attractive to us as selective active managers.
Market Disconnect
So while there’s no question that we were incorrect in thinking that investors would more readily recognize and then close this gap, we think a lot of small-cap cyclical companies have been disproportionately punished in the downturn to the point where many stocks look to us as if a recession has already been priced in—which makes them even more attractive to us.
How do you manage in a market where fundamentals have been solid-to-strong, but price declines have been severe?
CR To put it simply— we invest almost the same way we do in other market environments. We look out two to five years and ask ourselves if the company we’re analyzing looks fully capable of growing its market share—mostly by developing or enlarging its niche and/or expanding its margins. We also look closely at management to get a sense that these are the people best qualified to guide the company through difficult periods.
The primary difference now is that the disconnect we discussed earlier between business results and stock performance is in most cases even wider, so the risk/return prospect is all the more compelling given the state of valuations.
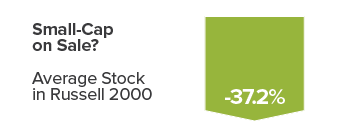
FG The metric we prefer, EV/EBIT (median ex-negative earnings), dropped from 19.5x on 12/31/17 to 16.4x at 12/31/18. That shows how much more appealing the market looked at the end of 2018 versus the end of 2017 for disciplined, selective buyers such as ourselves. For an additional sense of the opportunities the correction created, consider that the average stock in the Russell 2000 declined 37.2% from its previous 52-week high through 12/31/18. Of course, some declined more than that—energy stocks were off more than 50%, materials 42.5% and transportation was down 42.3%.
In what other areas were you most active when stock prices were falling?
CR In all of our strategies, we’ve been working to take advantage of long-term buying opportunities across a broad spectrum of sectors and industries throughout the correction. This includes companies involved in energy services, RV parts, infrastructure, laser-based photonics, shipping, trucking, banking, outpatient healthcare facilities, and semiconductor capital equipment. We’ve also been buying more of the companies that we know best, those in which we have the highest confidence, because they’ve demonstrated their ability to deal effectively with adversity in other down markets.
Has there been any significant change in tone or outlook in your meetings with managements this quarter?
FG Given all that’s been happening, some are in a watch-and-wait mode in terms of new orders or initiatives while others are moving forward because their business remains robust. Like the rest of us, they’re concerned about the conflicting economic data and wondering what the pace of growth will be in 2019. So we’ve been mostly encouraged by what we’ve been hearing. It’s important to us as disciplined small-cap specialists to know that a management team is being realistic about the current state of their business and industry. Are they as aware as they can be of both the opportunities and obstacles currently facing them? So far, we’ve been pleased with what we’ve heard.
Can 2018 be viewed as a “risk reset” on the slow road to normalization, one with lower returns and higher volatility?
FG I think so. Picking up on our earlier point, declines of this severity are almost always accompanied by an economic recession, a profit recession, or a financial crisis. Yet we are still a long way from any of those conditions. The U.S. economy and corporate earnings still appear to be on solid footing. In fact, the main reason we have doubts about the likelihood of recession, whether it would be homegrown or—for the first time in U.S. history—imported, is that the level of market turmoil simply doesn’t match the economic data. China, Europe, and Japan—all key economies, to be sure—have slowed down appreciably, but none are in recession. Of course, markets are forward looking, trying to predict the future by extrapolating what’s happening in the present. We think the market may be misreading the signs. It’s seeing the slowdown as an inevitable slide into a recession while we see it as the historically normal rhythm of an economic cycle.
We have a similar objection to the notion that the sell-off has been motivated by anxiety about yield-curve inversion. Inversions have been as sure a signal of recession, though not a cause, as history offers, but the two- and 10-year have not yet inverted. It’s also worth pointing out that when the curve has inverted previously, the economic contraction has been as far as 20 months into the future. Equally, if not more important, is that the industry analyses we conduct, and what we’ve been hearing from management teams all suggest guarded optimism or caution, not panic or capitulation.
“We’re confident in our holdings. They’ve generally got solid cash flows, modest valuations, effective managements, and encouraging prospects.” — Chuck Royce
Do you expect the market to rebound at some point in 2019?
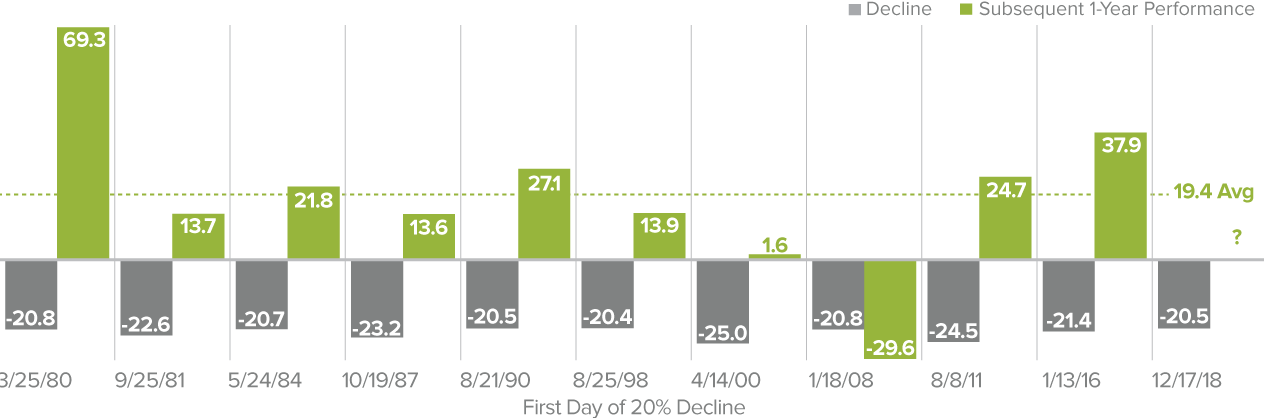
FG We do. We can’t say when or by how much, of course, but when we look at the current bear period from a market cycle perspective, there’s some encouraging data. 2018 saw the eleventh decline of 20% or more from a previous small-cap peak. In nine of the previous 10 periods, the subsequent average one-year return from the first day on which the index declined 20% from its peak was a positive 19.4%. The exception, unsurprisingly, was in 2008-09. These historical market cycle examples certainly suggest the possibility of a solid 2019.
After the Bear Market, Then What?
Subsequent 1-Year Performance of Russell 2000 after a 20% Decline as of 12/31/18
We think that small-cap returns were higher than what the fundamentals could support earlier in 2018. When the Russell 2000 was trading at record highs, it also had a lot of companies with ample debt and/or no earnings. During the downturn, it looked like the market was overcorrecting for this disjunct, and in a particularly manic fashion, to the point where many of our key fundamentals, such as growing operating income, are in many cases stronger than what valuations at year-end would suggest.
CR We’re confident in our holdings. They’ve generally got solid cash flows, modest valuations, effective managements, and encouraging prospects. These are the businesses that look most likely to weather or even thrive in a period with even more volatility and uncertainty than usual.
Article by The Royce Funds

