
A correction in the U.S. markets is long overdue…
You hear it all the time, including from us.
Q1 hedge fund letters, conference, scoops etc
We’ve written before about how the U.S. bull market is losing steam… how the market is “stretched”… how geopolitical risk is rising… and that the “Trump Rally” will (eventually) confront reality.
But that doesn’t mean you ignore the biggest stock market in the world. And if you’re not invested in the U.S. (and you’re not in the U.S.), it might be time to break out of your home country bias and look at the U.S. market again.
Why?
1. When you buy U.S.-listed securities… you’re buying the world
A large plurality of the revenues generated by companies listed on the S&P 500 actually come from outside the U.S. In 2016, 43 percent of the revenues posted by S&P 500-listed companies came from outside the U.S. And of course, many U.S.-listed companies are actually foreign companies – but they’re listed on a U.S. exchange because they want to go to where the investors, and money, are.
So when you’re investing in U.S.-listed stocks, your actual exposure to the U.S. economy is a lot less than you might think. And if you don’t buy American stocks, you’re missing out on a lot of the rest of the world.
Hedge Funds Off To Poor Start Led By CTAs
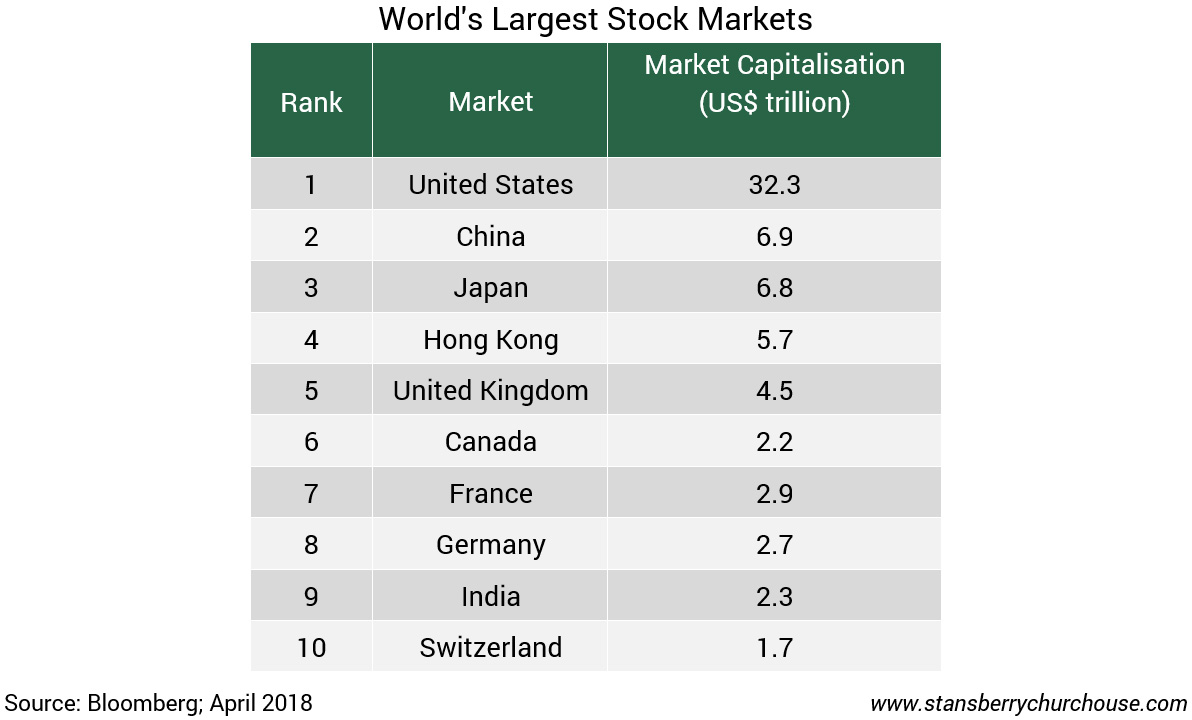
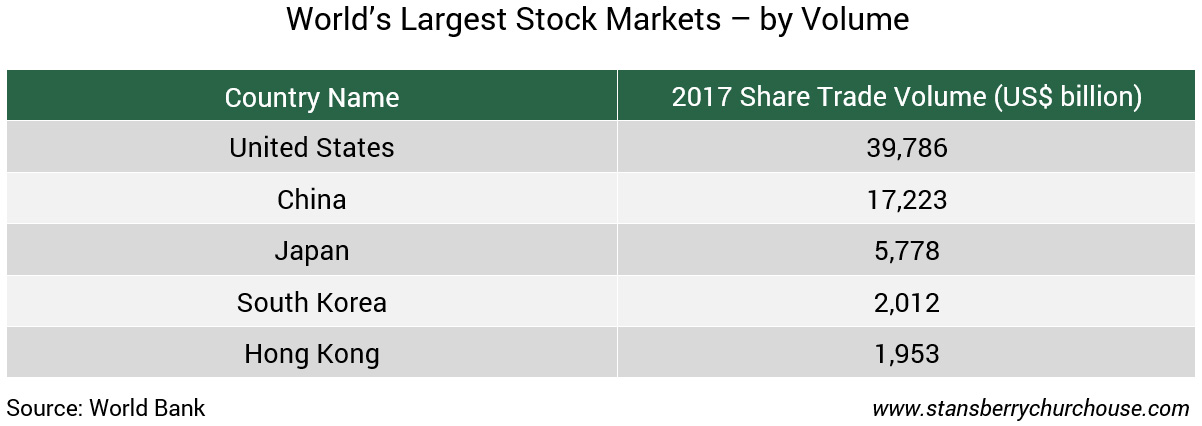
2. The U.S. is the most liquid and biggest stock market in the world
As you can see in the following chart, the U.S. is the biggest market (by market cap) in the world. Its market capitalisation is nearly five times China’s, the second-largest in the world.
The U.S. market is also the most liquid. Nearly US$40 trillion in trades went through U.S. exchanges in 2017, more than double China.
3. Some sectors of the U.S. market aren’t expensive
We’ve written before about how the U.S. market is expensive.
Idiosyncratic Risk On The Rise, Morgan Stanley Quants Warn
One of the best ways of measuring market value is to use the cyclically-adjusted price to earnings (CAPE) ratio. It’s a longer-term inflation-adjusted measure that smoothes out short-term volatilities to give a more comprehensive measure of market value.
As the chart below shows, the CAPE of the S&P 500 is now at 32.7 times earnings. That’s higher than at any time in history, except for the late 1990s dot-com bubble, and the stock market bubble of the late 1920s.
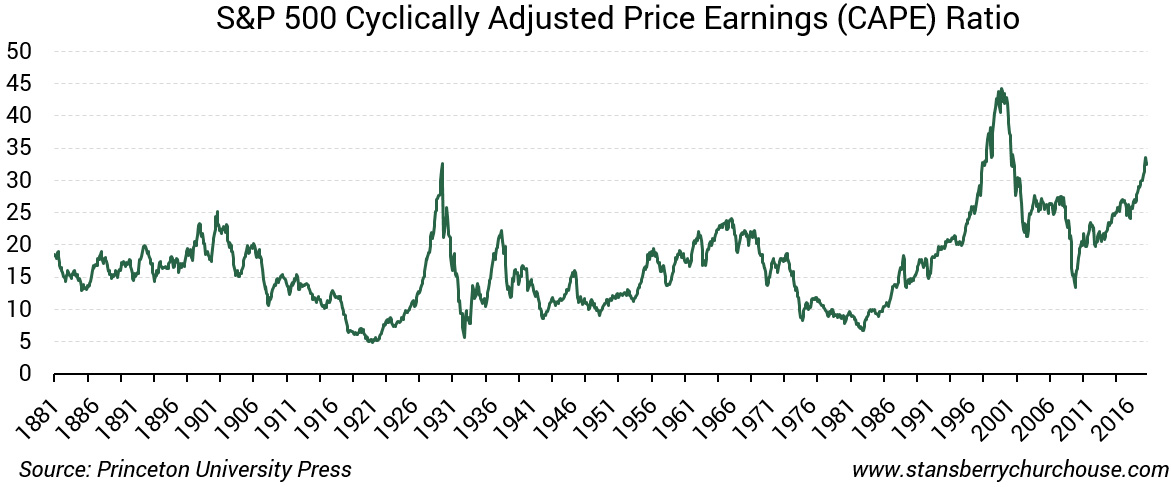
But this doesn’t tell the whole story…
The table below shows the current P/E of the S&P 500 by sector. While the index as a whole trades at a current P/E of just under 22 (well below its current CAPE), there are pockets of value in the index.
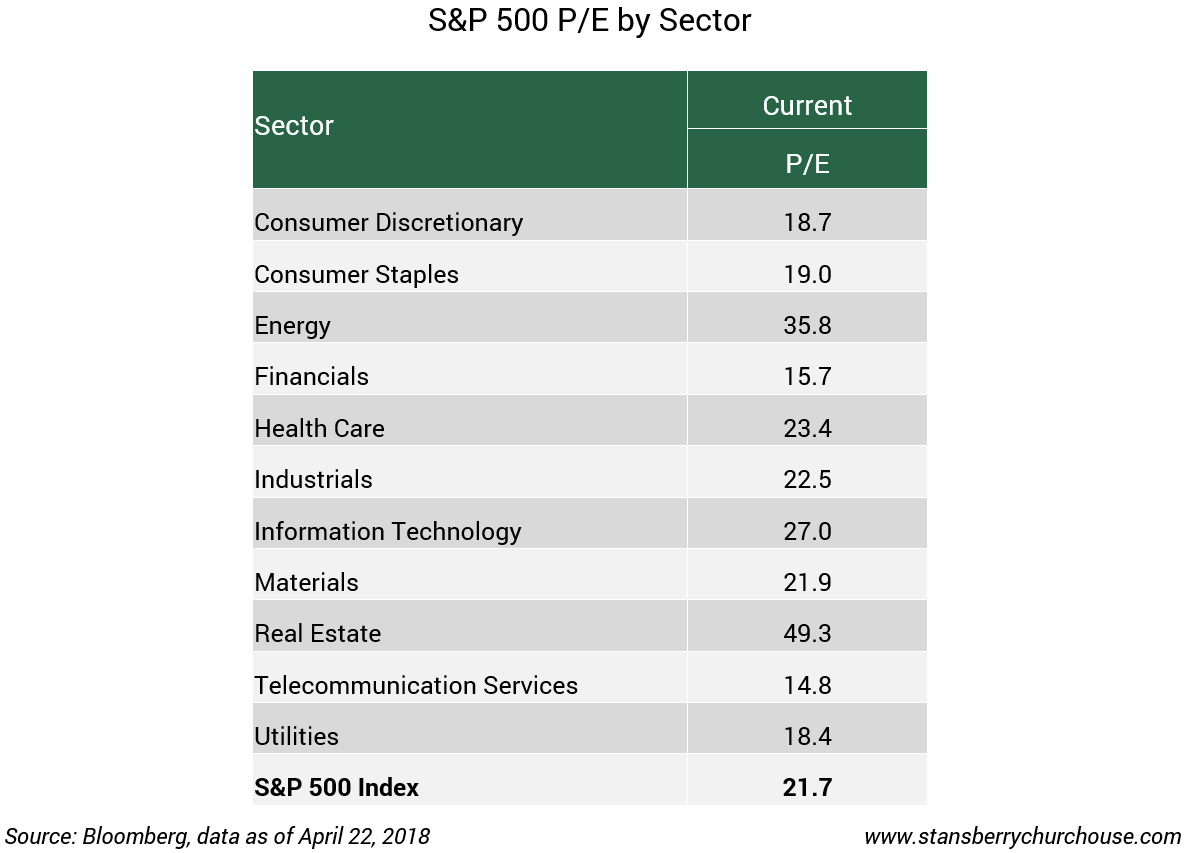
In particular, the telecoms sector trades at a P/E of just 15. The financials sector trades at a P/E of 16, and the consumer staples sector trades at a P/E of 19. These are a lot cheaper than the index as a whole – and potentially represent a better value opportunity.
4. Value is coming back
Speaking of value… as a whole, value stocks are due for a comeback, after years of suffering in the shadow of growth stocks. That is, we’re seeing investors buy strong businesses trading at historically cheap valuations, rather than fast-growing businesses trading at higher valuations.
As we shared in this recent essay from Dan Ferris, the U.S. market has cycled between investors buying growth stocks and value stocks.
For example, during the dot-com bubble, investors piled into internet stocks. These stocks soared higher… until they collapsed in 2001.
After the dot-com bust, investors ran from growth stocks and into conservative, value-priced stocks in mining, banking and real estate… and value stocks soared until the global financial crisis of 2008-2009.
Retail Investors Generate Rare Positive Performance In 2017, Report Shows
After the crisis, investors turned back to growth, in the form of technology stocks.
The following chart shows the Russell 3000 Value and Growth Indexes from 2007 to 2018.
As you can see, growth stocks – highlighted by social media, ecommerce and tech stocks – have been favoured at the expense of value.
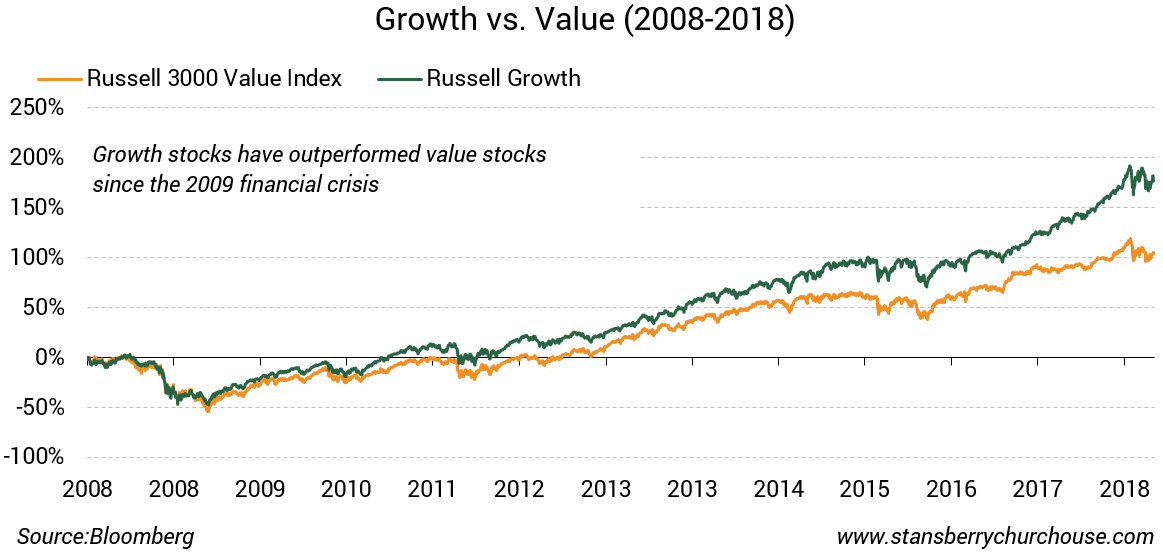
But we’re probably nearing the end of this cycle… And based on history, we could see at least eight years of value outperformance when this growth cycle is done.
That means now is the time to get into good U.S. businesses trading at historically cheap valuations.
To sum up, there are still opportunities in the U.S. market… make sure you’re not missing out on them.

