
FPA Capital Fund commentary and webcast slides for the fourth quarter ended December 31, 2018.
Q4 hedge fund letters, conference, scoops etc
- FPA Capital Fund 4Q18 Webcast Audio
- FPA Capital Fund 4Q18 Commentary
- Portfolio transition:
- Why do we still own energy-related equities?
- Marginal Cost of Production
- Stock Selection, Valuation, and Allocation Decisions
- A source of relative outperformance in the fourth quarter: Arrow
- What opportunities are we seeing now?
- Conclusion
- FPA Capital Fund 4Q18 Webcast Slides
FPA Capital Fund 4Q18 Webcast Audio
FPA Capital Fund 4Q18 Commentary
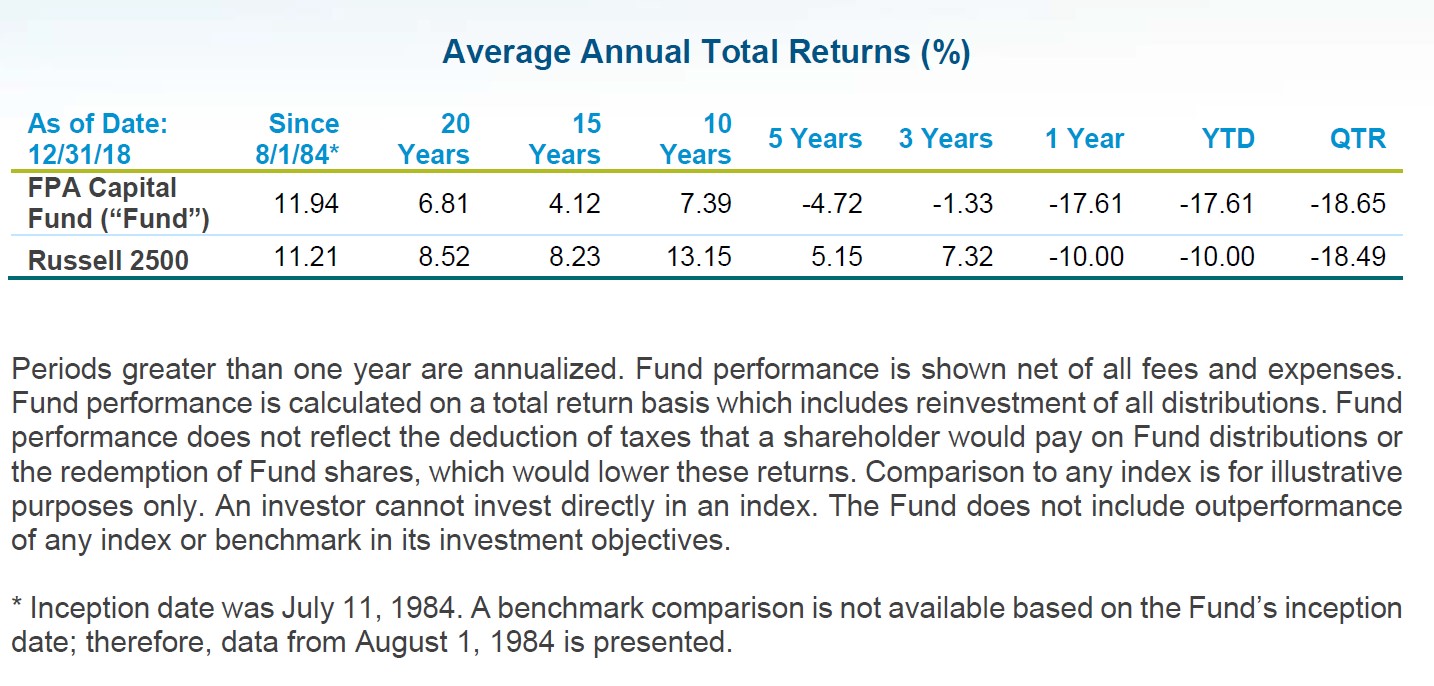
The FPA Capital Fund, Inc. (“Fund”) was down -18.65% (net) in the fourth quarter of 2018 vs. Russell 2500’s performance of -18.49%. We have previously discussed how expensive valuations have become and warned that this level of what we called “overvaluation”, was not sustainable. It seems that the market finally arrived to our conclusion – the Russell 2500 hit its lowest level in over 25 months on December 24, 2018.
We have discussed in our prior commentaries our belief that the portfolio is cheap as compared to the Russell 2500 index.
As of 12/31/2018, the Fund’s portfolio’s earnings multiple is 43% lower than that of the Russell 2500 Index and its price-to-book is 33% lower.1
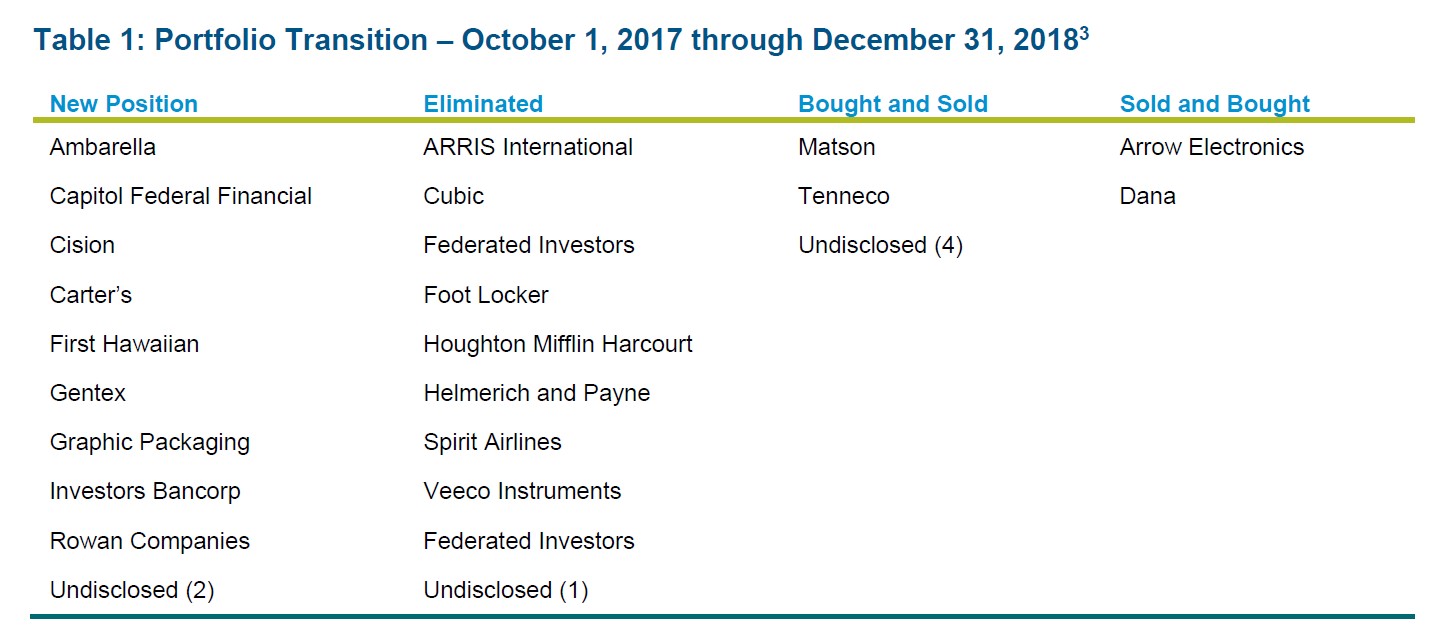
Portfolio transition:
The portfolio transition we have discussed in our past four letters is finally behind us with the exception of our energy-related equities. As a reminder, when I became the sole portfolio manager, I committed to the following: re-underwrite all the old positions and assess whether they still belong in our portfolio; be more nimble with increased attention to adjusting position sizing when there are changes in our analysis and/or the risk/reward profile; and increase the quality2 of the portfolio positions.
When the third quarter 2017 started, there were 22 positions in the portfolio. I took ownership of the portfolio at the beginning of fourth quarter 2017. Today, there are 24 positions in the portfolio but the makeup of the portfolio is very different. In the past five quarters, we initiated 17 new positions, six of which we subsequently sold. We also eliminated 12 positions, two of which we subsequently rebought. (See the Table 1 below for detail.)
In our opinion, the resulting portfolio holds higher quality businesses. High quality can come in a variety of forms, such as a strong market position, pricing power, or a unique business model that we believe can translate into a high return on capital over a market cycle.4 We have been more vigilant and disciplined about exiting what we believe to be lower quality businesses once their valuations improve beyond a zone we view as undervalued. As such, you can expect us to trim our lower quality energy holdings once prices normalize (again, market conditions permitting). That does not mean that we will not occasionally take positions in lower quality businesses when they become undervalued relative to our estimates on fair value (e.g., some energy names following the Great Recession, or where they are trading today).
Why do we still own energy-related equities?
Energy accounted for more than 60% of our negative performance during the quarter despite constituting less than a quarter of our portfolio. The rest of the portfolio’s performance was negative -8.95% (gross) – better than that of the Russell 2500.5 Let us discuss why we continue to believe that these investments offer upside potential.
As of the end of 2018, the portfolio’s allocation to energy investments stood at 23.6% vs. the Russell 2500 Index weighting of 3.2%. Given the size of this over-allocation, and in light of what has been a sharp downturn in both oil prices and related equities, we wanted to dedicate a portion of this letter to explain the underlying reasons why we continue to hold a large exposure and how this ties in with our value-oriented investing process.
Marginal Cost of Production
Investing in any commodity driven business requires a view on the marginal cost of production, which by definition is the incremental cost to produce one additional unit of something. In the oil market, we have to question what it costs to produce the last, most expensive barrel globally and how does that stack up to the current commodity price environment?
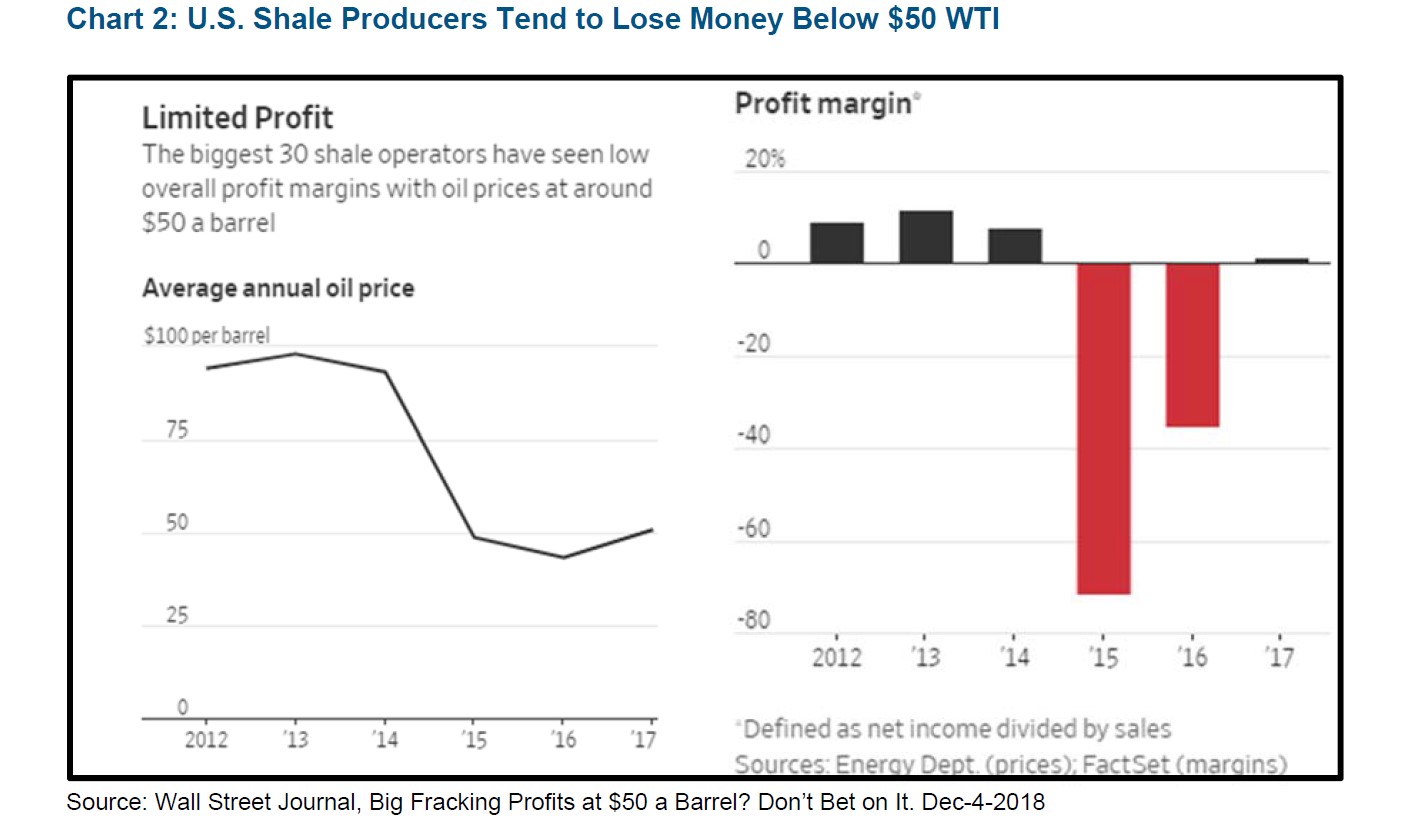
While lacking an industry standard6 calculation, there are a number of industry estimates on what this cost curve looks like. In general, these estimates, combined with objective evidence (e.g., changes in global capex and rig counts, producer returns and cash burn, bankruptcies, etc.) suggest that the global value chain may experience severe stress at certain low prices, while much higher prices may lead to an unsustainable surge in production. The charts below show the relationship between U.S. crude production (U.S. producers are lower on the global cost curve) and WTI7 prices as well as the relationship between WTI prices and profit margins at the largest U.S. shale producers. Notice that $50/barrel WTI tends to mark when production slows/declines and when net profit margins turn negative.
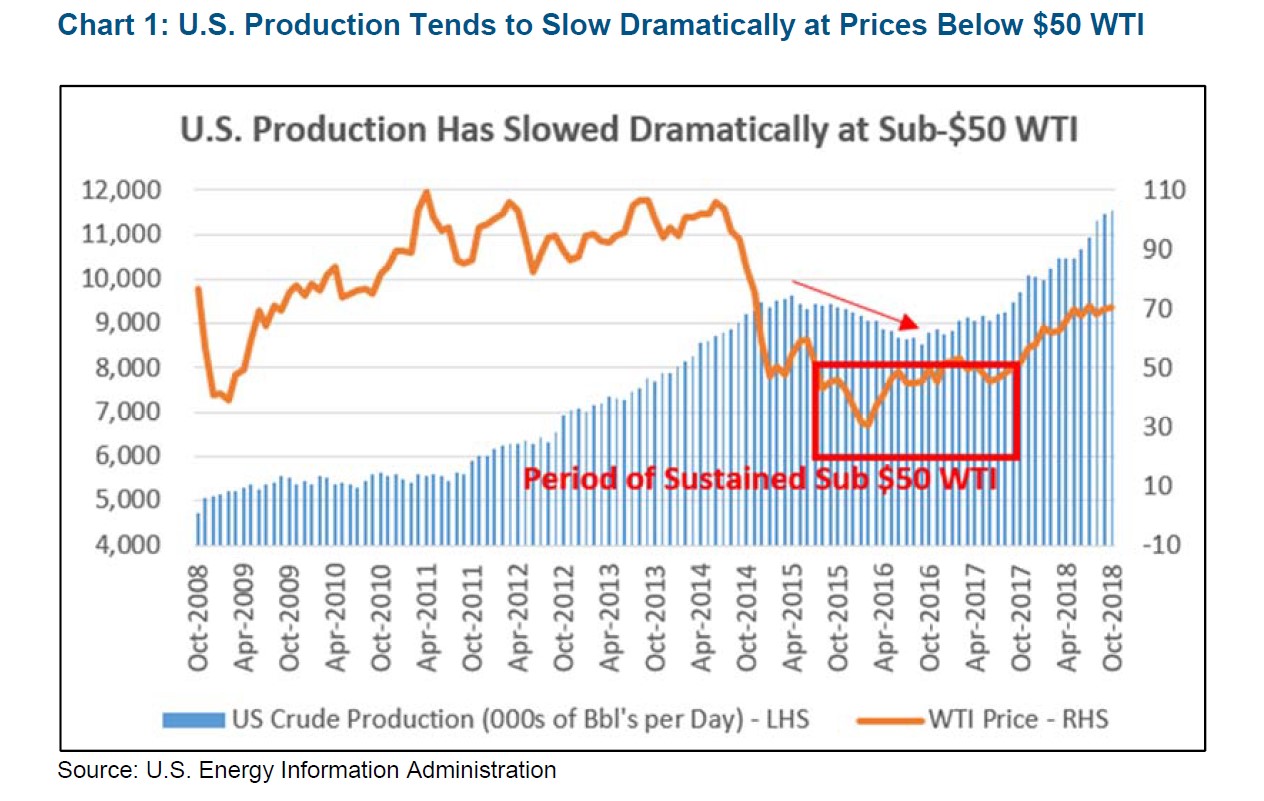
When the producer with the highest cost burden experiences stress, their production ultimately declines, thus requiring someone else to replace it in an environment of growing demand. Most of the macro work that helps inform our detailed company analysis revolves around the key producers driving global supply growth and their respective marginal cost of production. Understanding their marginal cost of production helps us frame a margin of safety. Since the 2014 oil price downturn, the primary incremental producers have been the U.S. (via shale growth) and OPEC. One has trouble growing at <$50 oil prices and the other seemingly wants much higher oil prices than where we are at today.
U.S. shale producers have had trouble producing profits at $50/barrel and plowback ratios8 have been declining as investors have pushed back on companies that cannot grow without reliance on external capital.9 At the same time, we have also talked about OPEC (most importantly, Saudi Arabia) getting closer to its spare capacity limit and also needing higher oil prices to stem bleeding budget deficits and to support social welfare projects. These factors have translated to a concerted effort to reduce global inventories (and increase prices) since late 2016. The global inventory decline went off track this fall as President Trump convinced OPEC into ramping production under the impression that the U.S. sanctions would dramatically reduce Iranian oil exports (however, the U.S. issued last minute waivers to all major importers of Iranian oil). However, it seems OPEC and Russia are in the process of making an adequate adjustment by taking 1.2 million barrels per day off the market starting in January (note that Bloomberg reported that OPEC already cut just over 500k barrels per day in December10). We believe Saudi Arabia is targeting inventory levels corresponding with $80+ oil prices (they need ~$90/barrel to balance their budget).
Stock Selection, Valuation, and Allocation Decisions
Our individual energy equity holdings are selected primarily for asset quality (e.g., well productivity, future inventory, etc.), management teams that have a track-record of creating value from these assets, and balance sheets that we believe can weather severe down cycles. Of course, we also want to own businesses with these characteristics at prices well below intrinsic value.
We evaluate the intrinsic value of the Fund’s Exploration & Production (“E&P”) companies both via near term cash flow and via long-term cash flows discounted back to the present value less liabilities (net asset value). While there are a number of assumptions that drive these models (e.g., production growth, cost structure, required investment, etc.), none is more important than the commodity price inputs. This then ties back to our earlier discussion about the marginal cost of production. If U.S. shale is a key incremental growth driver, on the lower end of the global cost curve, and experiences negative production growth at less than $40/barrel, then intuitively, we think it makes sense to model long-term downside at $40/barrel. Conversely, there must be a long-term price ceiling that will inevitably push supply above global demand. Unfortunately, the ceiling price seems less clear than the floor price and this informs our conservatism surrounding the price deck used in determining E&P companies best-case intrinsic value. In other words, we are not recklessly gunning for $80+ oil prices discounted in perpetuity.
Our E&P company models allow us to estimate what price of oil (as well as gas and natural gas liquids) is reflected in the current stock price at conservative cash flow multiples. We have talked at length about the fact that our E&P equities have recently reflected a large price discount relative to the underlying commodity price (both spot and forward prices) and that such discounts have historically closed over time. The Fund’s current allocation to E&P companies is near its maximum allocation range and this is because we estimate that current stock prices are reflecting future oil prices close to or even below $40/barrel in perpetuity – prices we view as completely unsustainable. On the flip side, we have discussed our systematic trimming activity in prior quarters as the Fund’s E&P stocks began to drift towards the higher end of what we assumed was the long-run sustainable oil price range at that time.
The Fund also owns three oil field service (“OFS”) investments – all of which have different business models and require different methods to assess normalized intrinsic value. While the price of oil dictates the level of demand for oil field services, there isn’t a good way to precisely tie the oil price to each company’s valuation. Instead, companies that the Fund holds, such as Patterson-UTI Energy (“PTEN”) and Rowan Companies (“RDC”), provide useful public disclosures relating to their historical utilization rates and unit economics of their assets (i.e., PTEN with their onshore drilling rigs and pressure pumping fleets; RDC with their offshore drill-ships and jack-up rigs). We can use these disclosures, in combination with a constantly updated view of the current cycle, to apply what we believe is a reasonable set of assumptions on midcycle utilization rates, unit revenue, and unit costs in order to reach an estimate on normalized intrinsic value. Interestingly, our modeling currently suggests PTEN’s stock price is ascribing roughly zero value for their pressure pumping business (despite $315mm of TTM segment EBITDA)11 and onshore drilling unit economics that are roughly in line with the most recent quarter. In our view, these kind of implied fundamentals also seem unsustainable, which is why PTEN is our largest OFS investment.
A source of relative outperformance in the fourth quarter: Arrow
Given the relatively choppy markets this past quarter, particularly for technology stocks, we wanted to review a few of our technology investments that we consider relative safe havens. As shown below in Chart 1, one of the Fund’s technology distributors, Arrow Electronics, Inc. (“ARW” or “Arrow”), performed well relative to the broader market and to relevant technology indexes during the 4Q 2018.
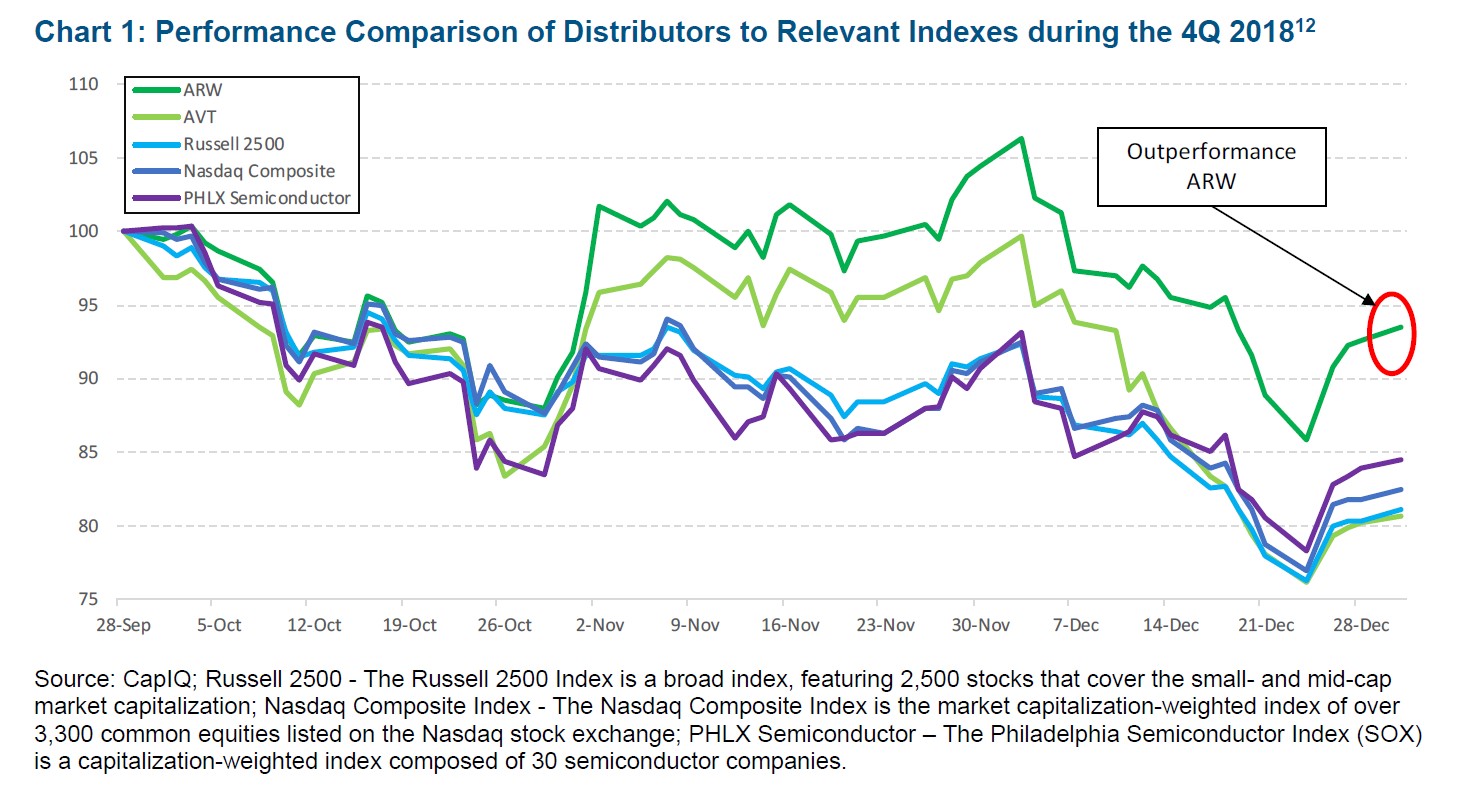
And while our other technology distributor investment, Avnet, Inc. (“AVT”), only performed in line with the broader index and relevant technology indexes, we think it’s too early within the current semiconductor downturn to judge its performance as these downturns have tended to last closer to 15 months and we are only on month six.
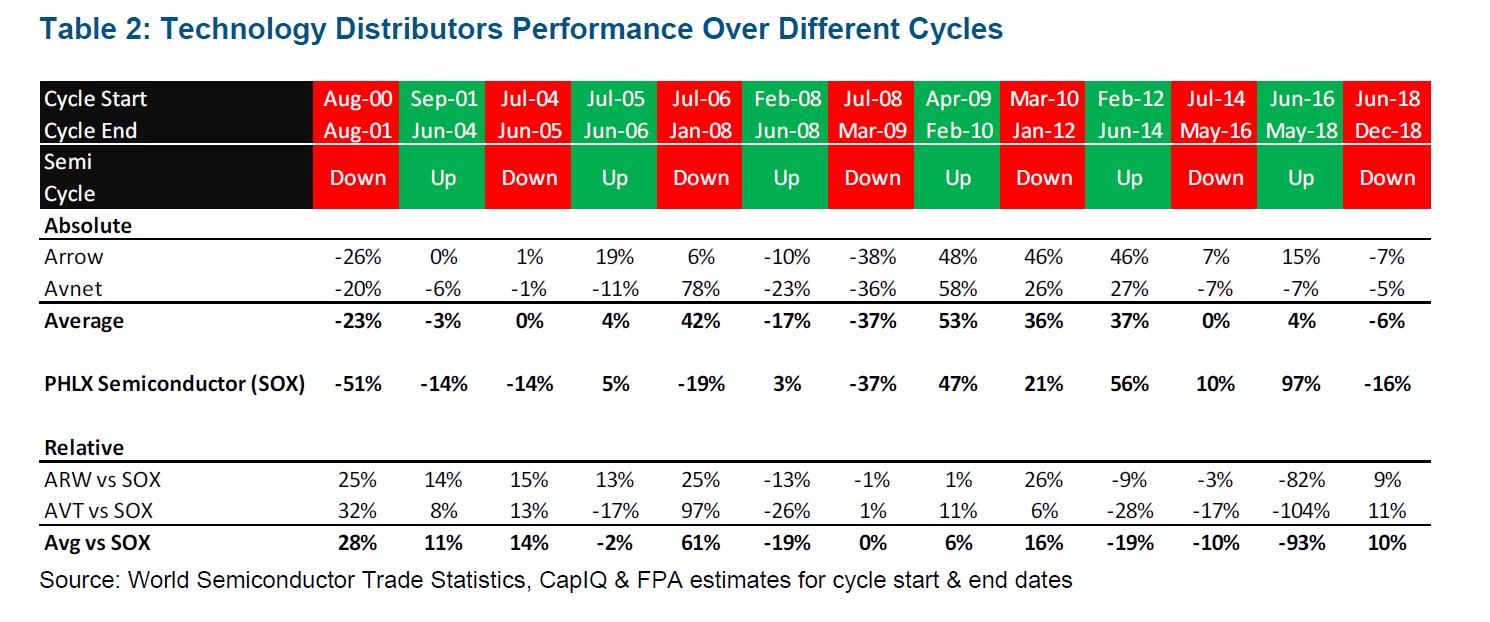
Arrow’s outperformance comes as little surprise to us as one of the features that we have liked about technology distributors is their resiliency during a semiconductor downturn. As shown in Table 2, outside of the financial crisis and the dotcom bust, these stocks historically have tended to outperform during a downturn, often even posting positive gains.13
Our investment thesis for both of these businesses is relatively simple. They are highly diversified, marketleading companies that have generated low double-digit returns on capital despite their relatively thin margins. We consider these returns reasonable, but not juicy enough to attract new entrants (read: Amazon) any time soon. Furthermore, we see these businesses as difficult to disrupt as they are not wedded to any particular technology and we expect continued top-line growth and margin improvement from both businesses over time. Finally, these firms tend to make large investments in working capital as they grow and can harvest these investments when their markets are shrinking producing countercyclical free cash flow. The free cash flows that may be generated during a downturn allow management to take advantage of attractive mergers and acquisitions (“M&A”) opportunities or repurchase their own shares at discounted prices.
In addition to the above, we believe Avnet’s management team is executing on several self-help opportunities that we think make that investment even more attractive and have sized the investment accordingly. In particular, management has embarked on a $240mm cost saving initiative that we believe is already bearing fruit and they are also working on increasing their working capital efficiency, which may ultimately free up close to $1b of additional capital.
We are not expecting straight-line, up-and-to-the-right performance out of these investments, so we intend to stay nimble and will look for opportunities to add to these positions should a broader market drawdown give us the chance to.
What opportunities are we seeing now?
With the market finally starting to weaken, value investors like ourselves are hunting for bargains in some of the more beaten down, cyclical names. We are applying a few lessons learned to our purchasing process and wanted to share those with you:
Buy when there is a debate about how bad the current downturn will be, not whether the downturn has begun
Once there is agreement that the current end-market downturn is underway, valuations tend to reflect this much faster than the underlying fundamentals. So while earnings estimates may continue to correct downward, often times the stocks have already seen their largest drawdowns from the peak. This isn’t to say the bottom has been put in place, but it is a good place to start building your position.
Separate cyclical declines from secular declines
It’s important to understand what has caused the decline in the business. We are looking for opportunities where a traditional cycle is playing out and where we think past cycles can adequately help us forecast a range of normalized earnings estimates. We are looking to avoid situations where secular pressures are changing industries, competitive dynamics, complicating our ability to estimate normalized earnings.
Just a cheap valuation isn’t sufficient
The classic P/E ratio is less useful when looking at cyclicals. Cyclicals look cheap at the top of the cycle and expensive at the bottom. And yet, the optimal time to purchase a cyclical is at the bottom of a cycle. We will be looking for companies that meet our investment criteria (e.g., market leading, strong balance sheets, history of profitability, good management teams, etc.) and then will be looking at alternative methods of assessing value rather than simple ratios like a classic P/E ratio.
Space out purchases
It’s easy to get excited when a stock has experienced a material drawdown from its 52-week high. But it’s important to be disciplined and space out purchasing levels sufficiently to leave enough dry powder to size-up a position at the right time. This lesson is particularly relevant for cyclicals where drawdowns can often exceed what seems rational. We have established purchasing plans for all of the cyclical stocks we are interested in assuming relatively large swings are possible.
By keeping these lessons learned top of mind, we plan to continue taking advantage of future market volatility and purchase quality companies at opportunistic valuations.
Conclusion
The week before Christmas marked the worst weekly stock price performance in a decade. The US stock indices are well below their record highs. We have started using some of our liquidity to both initiate new positions and add to many of our existing ones.
The Fund has underperformed to this extent only twice before. The first time was leading up to the dotcom bust (3/1998-3/2000), and the second time was leading up to the great financial crisis (10/2005-10/2007). During both of those times, valuations were stretched. Following both of those periods, the Fund’s performance rebounded.14
While we cannot project a specific return over the upcoming months and years, the setup looks eerily similar to us today: all-time highs in stock indices are hit, there is a sudden and sharp decrease in stock prices, the portfolio is already cheap relative to the Russell 2500 Index (price to earnings and price to book ratios are two ways to judge this) and the Fund has ample liquidity to take advantage of this dislocation (the Fund’s cash level at the end of the year was 28.5%).
We are grateful for the trust you have placed in us to manage your capital, and we sincerely appreciate your support. We wish you a prosperous, healthy, and rewarding New Year!
Arik Ahitov

