
This is an interesting topic for a few reasons, especially from a timing standpoint, but perhaps most interesting of all is how whenever I talk about global ex-US equities I tend to get significant push-back.
Q3 2019 hedge fund letters, conferences and more
For example, many will say that it’s not worth going outside of the US equity markets because the places in developed markets like Europe and Japan are a mess politically and have stagnant growth and poor demographics, or they will note how emerging markets suffer from poor governance, or even that they can simply gain EM exposure by buying US companies that do business there and not worry about FX or market access etc.
There’s probably an element of truth to all of those, but here’s the problem, these are all exceedingly obvious (which is a dangerous word when it comes to formulating investment strategy!), they also are quite surface-level observations, and often miss or underweight some of the more important factors and drivers of risk/return.
So why is this topic even of interest anyway, and why now? The chart below shows the relative price performance of US equities vs global ex-US (emerging and developed ex-US). The chart shows there are clear (circa-10 year) cycles of relative outperformance vs underperformance, and right now it looks like we are nearing the end of another 10-year cycle of outperformance…
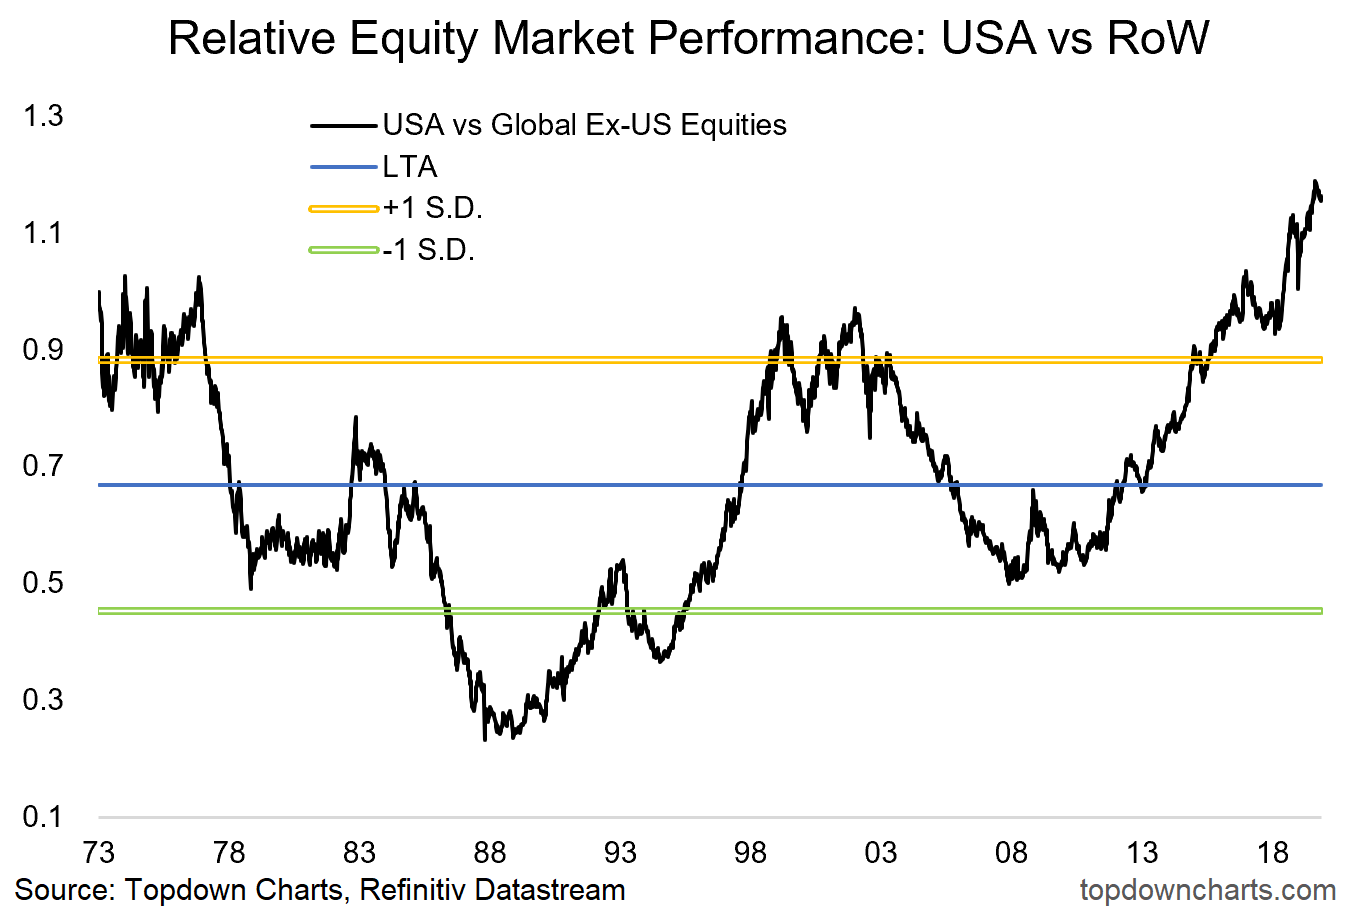
It’s not something to take lightly trying to pick a major market cycle turning point like this as it goes against one of those old market axioms: “the trend is your friend”. But thankfully there are a few clues left over from past cycles, and that brings us into the charts…
- Valuations: Global ex-US vs USA
One of the key anchor points in my process (for every asset class, not just equities) is valuations. Valuations can be a bit of a dark art and, outside of extremes, often speak very quietly when it comes to market timing. But they help in setting the directional bias i.e. if an asset is “cheap” then all else equal you’d want to own it, and if an asset is “expensive” then all else equal you’d want to sell it or at least underweight it within an asset allocation framework. So it’s interesting then to note the widening valuation gap between US equities and global ex-US (and this is both emerging and developed ex-US). Currently there is close to a 50% valuation discount priced in. Back to my comments at the start, yes global ex-US has its problems, but are they 50% discount problems? At a certain point if the valuation gap is wide enough it kind of starts to speak for itself.
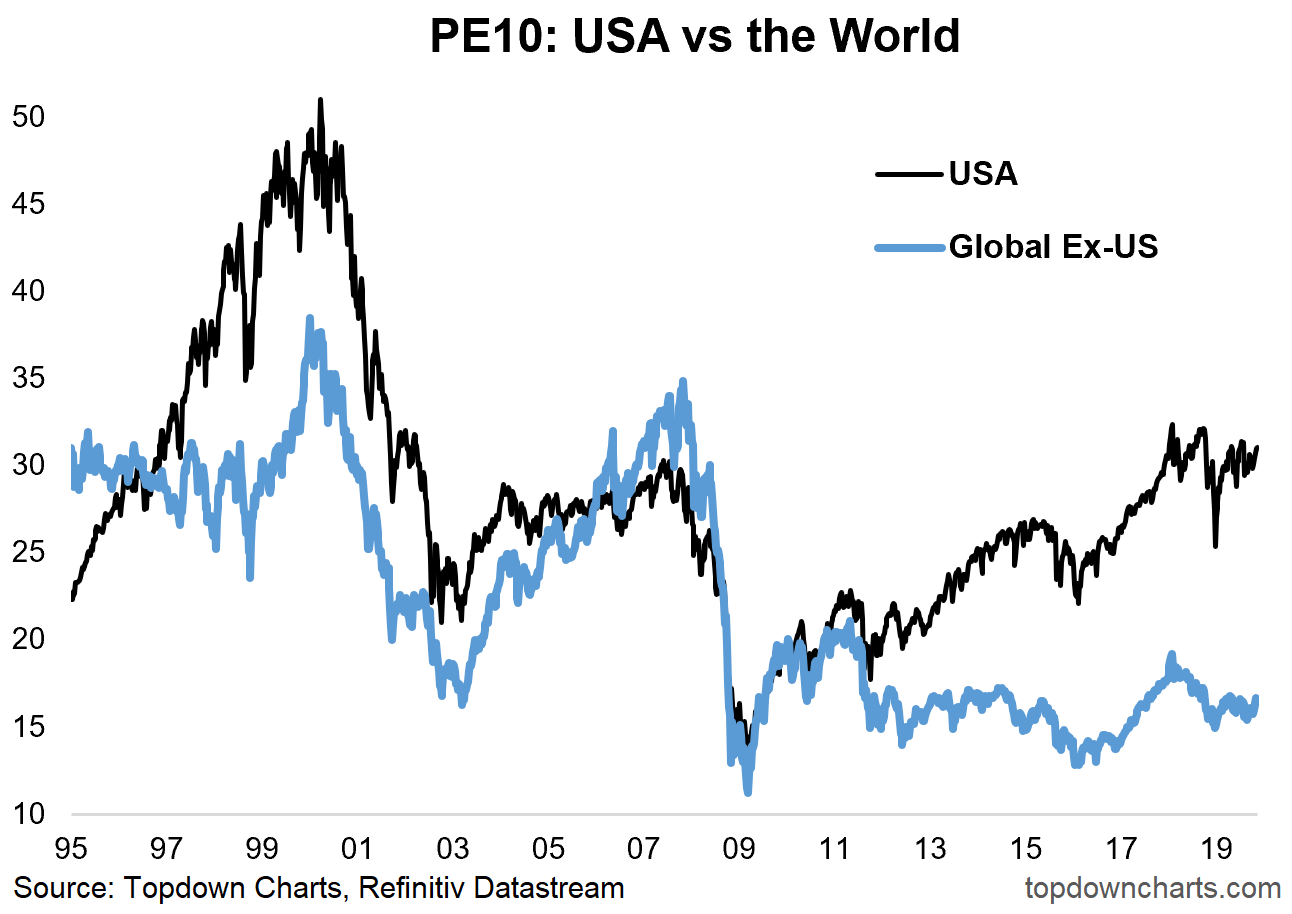
What to watch for: perhaps most interesting, and certainly worth highlighting, is that global ex-US valuations are cheap relative to their own history too. This is important, because if they were both expensive then the odds of a closing of the gap by one market falling less than the other would be higher, rather than more of a catch-up scenario which I think is more likely.
- Macro: One of the Two Key Swing Factors
Anyone who has spent time on valuations knows that it’s only one piece of the puzzle. In fact, you could have argued a strong valuation case here through much of the past 5 years. What’s required is a swing in some of the other factors, and that brings us to one of what I would say are the two key swing factors here. As regular readers and clients will know, my base case is for a global synchronized economic rebound into 2020 (I’ll be writing an outlook piece for the blog later this year that will touch on this), and this is important. Firstly, the rest of the world went into their slowdown earlier and deeper than the US, and secondly, although the Fed has been the most highest profile in pivoting to easing, emerging markets and select developed economies have been very proactive in bringing stimulus online. Basically what I’m trying to say is that there is both greater scope for the rest of the world to surprise to the upside, greater room to move, and a decent chance the global economic rebound is primarily driven offshore. This will be important in shifting sentiment, and will play into the cyclical earnings picture also.
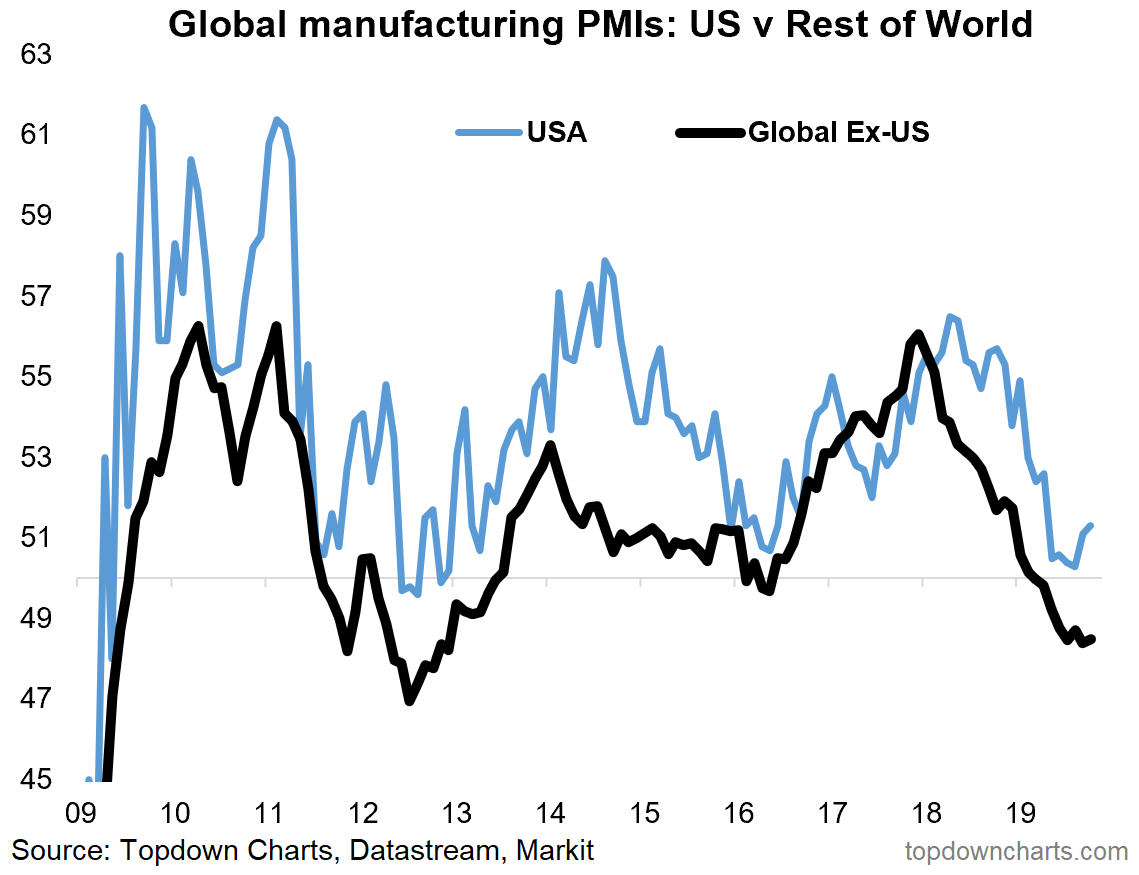
What to watch for: basically what I am watching for is confirmation in the data, and that a few key leading indicators continue to operate as expected. In many ways it’s a case of a higher beta to the global economic rebound, but it’s not just as simple as that either.
- FX: The Other Side of the Coin
Excuse the pun, but the other side of the coin is the US dollar. The US dollar remains one of the most important (but not to the point of excluding other signals and data) variables in forming global cross-asset investment strategy. Interestingly enough the US dollar also seems to go through roughly 10-year cycles of strong/weak performance, and I would argue the secular bull market in the US dollar is in its final innings, and this will be a key factor in relative performance of US vs Ex-US equities. One reason is the global liquidity aspect (a weaker dollar typically drives easier financial conditions offshore), another is the simple translation/FX effects (if the US dollar weakens and global ex-US equities just match US equities’ performance in local currency terms, then in translated terms global ex-US outperforms), and yet another is flows (investors tend to chase past performance, so often end up reinforcing these dynamics). Whether you agree with my prognosis on the US dollar, I think we can agree that it is one of the key swing factors here.
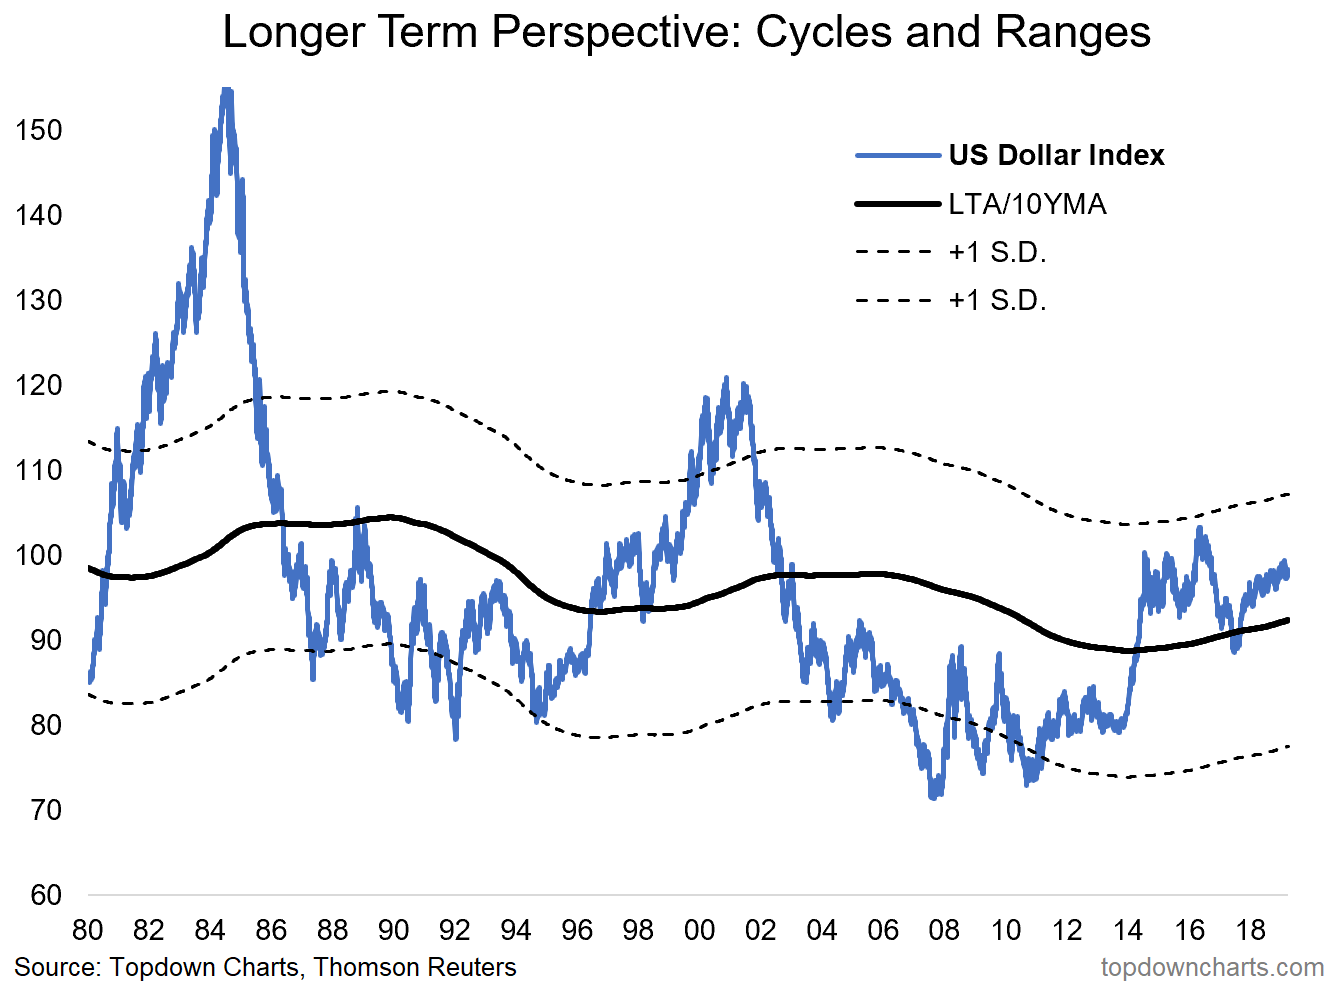
What to watch for: the DXY has delivered maximum pain and confusion to maximum participants this year as a litany of false break-outs/downs have left both bulls and bears scratching their heads. Key will be for a decisive break, and when you have a major volatility compression like what we are going through now with the DXY, it tends to resolve explosively – so when the DXY does finally make a clear clean break either way it will probably be a swift, substantial, and sustained move. I’m bearish on the US dollar for a few reasons, but I’m listening carefully to what price may tell me about the accuracy of my views in the coming months and quarters (and years for that matter).
Final Thoughts and Bottom Line
Bottom line: my view is we are basically at the end of the latest decade-long cycle of outperformance of US vs global ex-US equities. Valuations, macro, and FX support this view – and the charts and principles in this article set out the framework for judging the probabilities and next steps.
I don’t really have any other final thoughts this time, but I would point out something I mentioned in passing. Relative under/out-performance corrections like what is outlined in this article can happen for “good reasons” and “bad reasons” — that is, you could see global ex-US outperform US if *all markets* fall, but global ex-US falls less (bad reasons). That’s fine if you are benchmark aware or long/short, but for those more interested in absolute returns they are more interested in the “good reasons” version where both markets rise but one rises more than the other (or more rarely, where one market rises and the other falls). As I noted, I think at least phase 1 of the relative performance reversion will be the “good reasons” version, but I’m not brave enough to bet on another 10 years of bull market… I’m happy enough with my cyclical bull market call for now.
Article by Callum Thomas, Topdown Chart

