
Equity market fundamentals are looking pretty strong around the world. Key indicators like interest coverage ratios and profit margins have improved to cyclical highs. Interest coverage has also been helped by a couple of notable trends such as lower borrowing costs. But, somewhat counter-intuitively, it looks like investors in global equities were rewarded more over the medium-long term when these indicators were in a cyclical downturn…
Q1 hedge fund letters, conference, scoops etc, Also read Lear Capital: Financial Products You Should Avoid?
The main points on the cycles/trends in global equity fundamentals are:
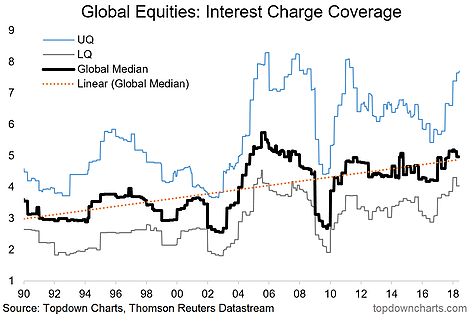
-As a result of low borrowing costs and improved profitability, global interest coverage ratios are looking healthy.
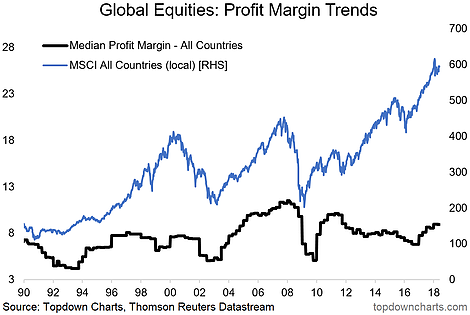
-Globally, profit margins have improved since the earnings recession (EM + Commodities) of 2015/16.
-It all looks pretty good, although the chart shows that investors were usually rewarded more for buying when profit margins were cyclically low vs cyclically high.
- Global Equities – Interest Charge Coverage: Globally there has been a noticeable uptrend in interest coverage ratios over the past 30 years. As with many fundamental indicators, there is a clear cycle around the trend as well. During the 2015-16 earnings recession there was a deterioration in interest coverage ratios, which has since unwound as the indicator has recovered to a cyclical high.
Naturally factors like the level of interest rates and leverage/debt loads likewise have a significant impact. So from a cyclical stand point, you would expect the interest coverage ratio to rapidly deteriorate towards the end of a business/market cycle as profitability comes under pressure and policy tightening pushes up borrowing costs. We saw this in the last two cycles, and thus it’s something worth monitoring.
- Global Equities – Profit Margin Trends: As for profitability, there is likewise a clear cyclical pattern of boom and bust across countries (note I have taken the median profit margin across 45 countries, with the intention of showing the general trend across countries rather than market cap weighted, and my preference is to use the median to reduce distortions in the signal from outliers).
As alluded to with the previous chart, profitability has improved in the last couple of years following the cyclical bust in 2015/16 (EM stress and Commodity crunch). In many ways it is similar to the mini-recession seen in the final stages of the late-1990’s bull market. So it all looks pretty good. I guess the only issue with that is judging by the chart below, generally forward returns were better when profit margins were in the doldrums!
Want an extra level of insight and service? Take a Free Trial of our institutional research service.
Follow us on:
LinkedIn https://www.linkedin.com/company/topdown-charts
Twitter http://www.twitter.com/topdowncharts
Article by Top Down Charts

