
With all the chatter about recessions and corrections, one could be forgiven for forgetting about one of the key concepts and tools in investing; valuations. Careful study of valuations can help identify relative opportunities, put time on your side, and help you get ahead of major market risks.
Q4 hedge fund letters, conference, scoops etc

The chart of the day here comes from a report on global equity valuations (which took a broader look at several valuation metrics).
The chart shows the PE10 valuation metric for the three major chunks of global equities: USA, EM (Emerging Markets), and DM Ex-US (Developed Markets excluding America).
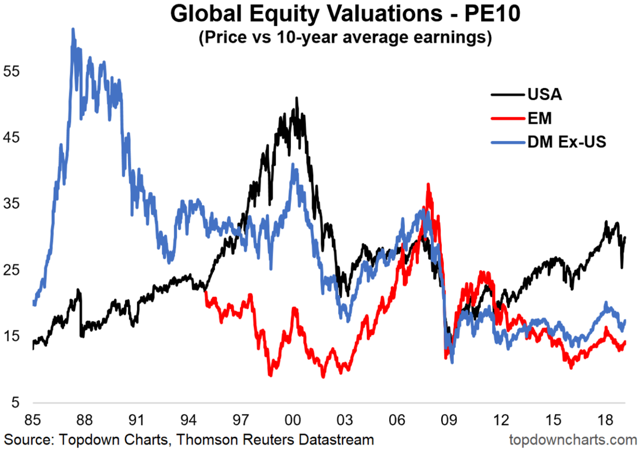
Firstly, a quick note on the methodology. What we’ve got here is the PE10 valuation ratio, which is price divided by trailing 10-year average earnings. This is in contrast to the trailing 12-month PE (which uses trailing earnings and is liable to giving wild and wacky readings at certain times), and the forward PE (which uses forward consensus earnings, which though it has its advantages also has limitations).
The PE10 helps provide a more accurate view by smoothing out earnings, but it can provide some misleading signals if there was a chunk of time in those 10 years where earnings were unrealistically high or low as compared to normal or expected normal… it is, however, my preferred of the 3 PEs.
Anyway, as for the key takeaways, after the correction and rebound it’s still a case of EM is at the bottom rung, DM Ex-US is not too far different, and the USA is off in another world. We know valuations matter importantly in developing expected returns, and in this respect, EM and DM Ex-US are operating with a major valuation tailwind, and America is operating with a major valuation headwind over the medium to longer term.
One thing I would point out is that although EM looks the cheapest on first glance, here’re some interesting stats: EM is trading at a 53% discount against US equities, this compares to the long-term average discount of 33%… DM Ex-US is trading at a 42% discount against US equities, which compares to a long-term average *premium* of 21%.
Thus, against their long-term averages, DM Ex-US is trading 63% below and EM is trading 20% below. In addition to that, EM is trading at a 19% discount to DM Ex-US, but the long-term average discount for EM vs. DM Ex-US is 21%. When you look at it this way, DM Ex-US starts to look more attractive on a relative basis.
So while EM equities look the cheapest on first glance, if you take history into account it may well be that DM Ex-US offers superior relative value. In any case, the gap between DM Ex-US and EM is not out of the ordinary, so it certainly gives food for thought on global equity allocations.
Article by Top Down Charts

