
This is the eighth of a 10-part blog series where I will go through each of the charts from the 10 Charts to Watch in 2019. The purpose is to add some extra comments and context around the charts, as well as to explain some of the finer details of the indicators.
Q4 hedge fund letters, conference, scoops etc
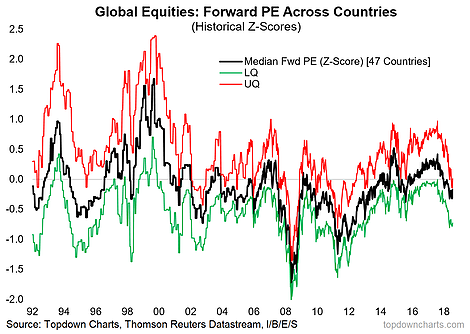
In this post we look at a particularly interesting and unique chart on global equity valuations. This chart tracks the median (as well as upper quartile and lower quartiles) of the historical z-score (i.e. standardized) of the forward PE valuation across 47 countries.
Hence it provides a good overview of the general trend in valuations across global equities.
The key point with this chart, and why it is worth talking about, is that median valuations went from expensive (materially above average) to now somewhat cheap following the global stock market correction. This what people mean when they talk about a “healthy correction”.
Indeed it wasn’t long ago that the big concern and talking point among bears was the issue of overvaluation and expensive markets (particularly the US), as I noted in the original post:
“In the wake of the global equity market correction it’s becoming easier and easier to find a bargain. Valuations have already reset to some of the previous major market lows. While global equities could get cheaper yet, the probability is increasingly in favor of long term investors at these levels.”
Another issue we had been talking about alongside this real issue of rising overvaluation, was the stretched relative performance of cyclicals vs defensives. As I mentioned earlier this week, this is an issue which has likewise mostly resolved. And now we are seeing a tentative rebound in cyclicals vs defensives across the major chunks of global equities – which goes against the increasingly popular narrative that we are entering a recession (not my base case).
So again, it really is worth reiterating that as we entered 2018 with increasingly expensive valuations across global markets, we now enter 2019 with many markets looking cheap again. Certainly the issue of expensive valuations has been taken off the table for the time being. For longer term investors, this one of a few key factors that can help tilt the odds in their favor…
For more and deeper insights on global economics and asset allocation, and plenty of good charts you may want to subscribe to our institutional research service.
Click through for free look or a trial…
Article by Top Down Charts

