
For anyone who has been looking at the detail across sectors, factors, and styles in global equities, there have been a couple of peculiar and extreme standouts.
Check out our H2 hedge fund letters here.
Relative performance across a select few factors and styles seem to have accounted for much of the new bull market in global equities, and what’s interesting is, the February correction did little-to-nothing to change this stark trend.
The chart comes from a recent edition of the Weekly Macro Themes report, which looked in detail at relativities in global equities, and how the extremes may resolve.
The chart in question shows the average relative performance across momentum, low dividend yield, growth vs value, and cyclicals vs defensives.
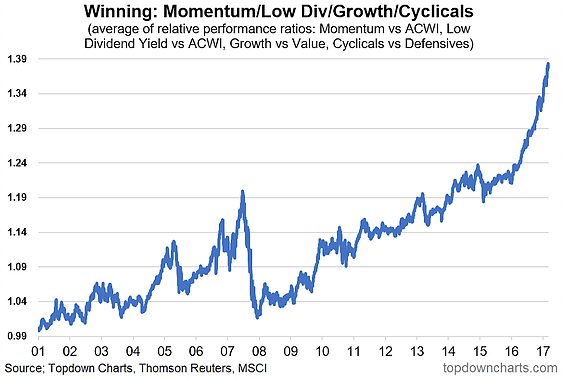
The line in the chart is a simple average of the aforementioned styles and sectors. So basically, it’s high growth, high momentum, low dividend yielding, cyclical stocks that have performed the best, and been the major drivers of the global equity bull market.
The growth/cyclicals aspect probably makes a degree of sense, given how widespread and substantial the acceleration in global growth has been. But even so, the performance since early 2017 has been simply extreme.
When you see extremes in markets you ought to pay attention. If there’s a rule of thumb that stands the test of time in markets, it’s that extremes don’t last. Indeed, often times extremes can unwind faster and further than you expect. I would say there has probably been substantial flows chasing these styles and sectors too and that his remains a key vulnerability for stocks, and a potential nasty surprise for those who jumped on the bandwagon.
This article originally appeared as a submission at See It Market
Follow us on:
LinkedIn https://www.linkedin.com/company/topdown-charts
Twitter http://www.twitter.com/topdowncharts
Article by Callum Thomas, Top Down Charts

