
Last year saw something exceedingly rare. For a period of 9 months there were exclusively rate hikes by the major central banks we monitor. But this period of tightening is turning, and now rate cuts are beginning to dominate again. If this was an important chart last year, you better believe it’s going to be an important chart this year.
Q1 hedge fund letters, conference, scoops etc
Today’s chart comes from a report I published last week which along with trends in global monetary policy also reviewed key developments in global bank lending standards.
The chart shows the monthly count of rate hikes and cuts by the 37 central banks we monitor, as well as the aggregated (GDP weighted) global policy rate.
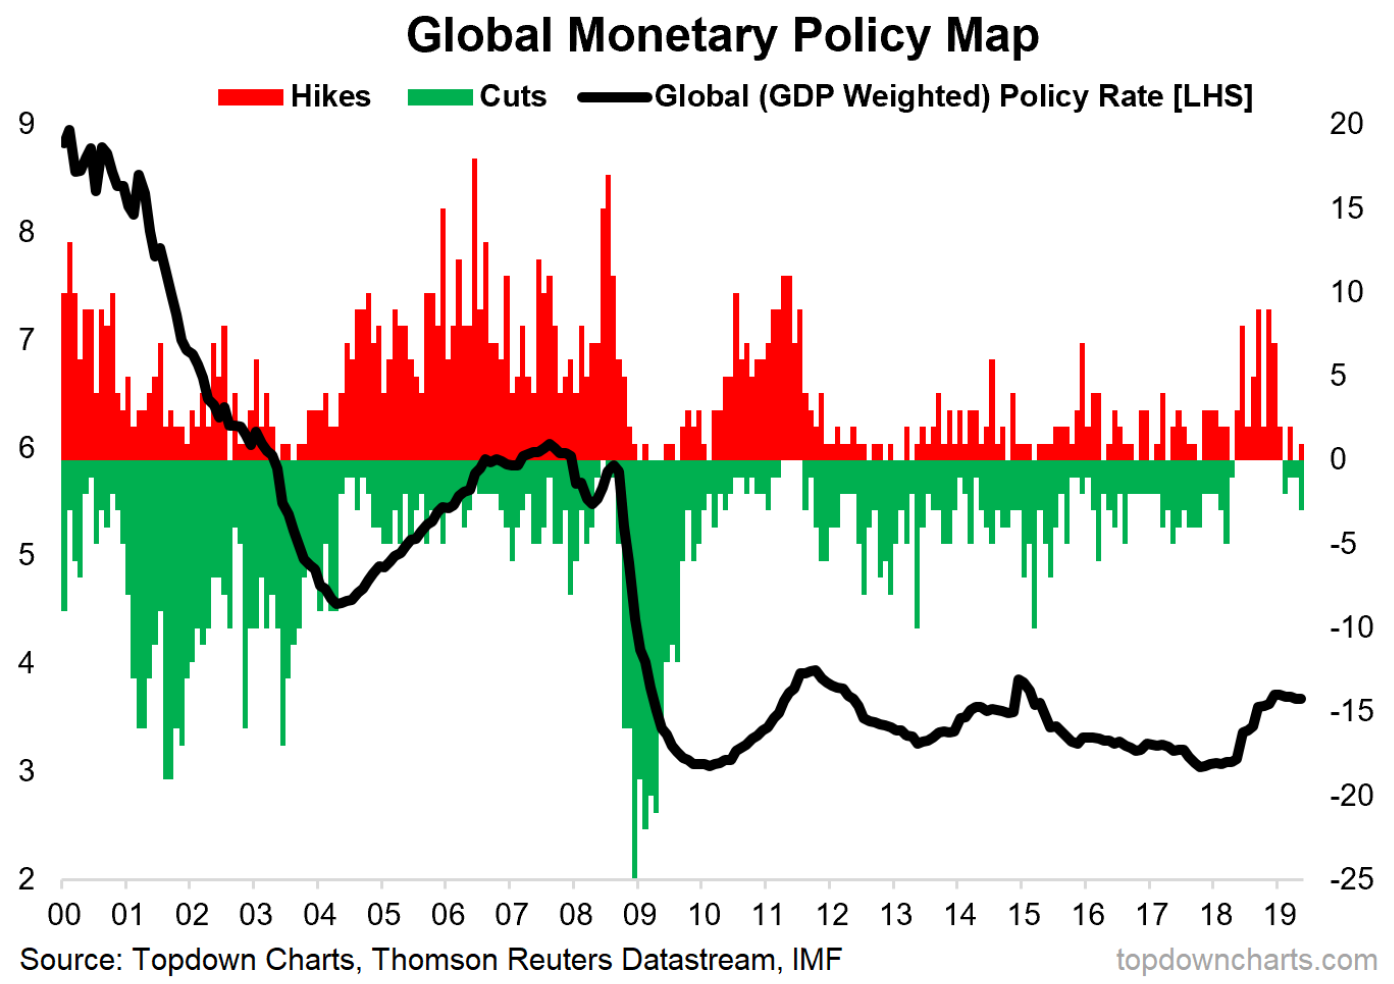
As I noted, 2018 saw a period of absolute rate hike dominance, and a sharp rise in the global aggregated policy rate.
Aside from the initial rebound post-crisis, this has been the sharpest period of monetary policy tightening since the global financial crisis. And if you consider Fed quantitative tightening and tapering by the ECB and BOJ, it truly was a period of substantial policy tightening.
Add to that the various other woes such as the trade wars, and you quickly begin to understand why we’ve seen global growth slow the way it has over the past 6-12 months. I think it says a lot about rising interest rate sensitivity, and the still fragile nature of the global economic system as lingering wounds from the financial crisis persist.
But as growth slows, we’re seeing the gears of global central banking start to shift, and as I noted at the start, it seems the tides are turning back to easing. This leaves a couple of questions…
First is, did we just witness a global policy mistake?
Second is, how much easing will come, and how fast?
My view is that central banks who have an inflation target should be easing preemptively (although in many geographies the writing is already on the wall so they should be moving already e.g. as they are here in New Zealand – the RBNZ just cut 25bps). The reason is if you believe the stories around structural deflationary forces (tech, globalization, automation, etc), then the risk of a deflationary overshoot is inherently greater than the risk of an inflationary overshoot.
So if you ask me, I would say expect more easing, but with many central banks reluctant to make a move, don’t have “hope” as your core strategy.
—
This article originally appeared as a submission at See It Market
Article by Top Down Charts

