
A few data points have come out on global trade over the past week so it’s worth taking a look at what has been a really key theme for the global economic recovery and acceleration that we have been seeing. Indeed, the global trade slowdown (basically a near-miss global recession) in 2015/16 was a key driver behind the route in commodities and global market turmoil that culminated in 2 stock market corrections and a drive lower in bond yields. It also helped spur on the ECB, BOJ, and China to undertake further stimulus, which has been key in driving the improvement that we have seen in global trade.
Anyway, as for the data, at a high level, the CPB Global Trade Monitor data showed global trade growth running at the strongest pace since the 2010 bounce back from the global financial crisis. This improvement has been matched in the industrial production growth stats. It’s also verified with the RWI/ISL global container throughput data, which shows volumes running above trend. Shipping cost indexes, while somewhat volatile, have also recovered notably, and are something we are watching closely for clues on the next steps.
But overall the key message is that global trade growth is looking good, despite the protectionist rhetoric, and this is a key piece of the puzzle in the synchronized global growth theme, and hence supports the overweight growth (equities) and underweight defensives (bonds) bias we’ve been maintaining.
The main points on the key global trade data sets we monitor are:
-The CPB global trade monitor showed the strongest pace of global trade growth in 2017 since the 2010 financial crisis rebound period.
-The RWI/ISL shipping container throughput index shows volumes running distinctly above trend.
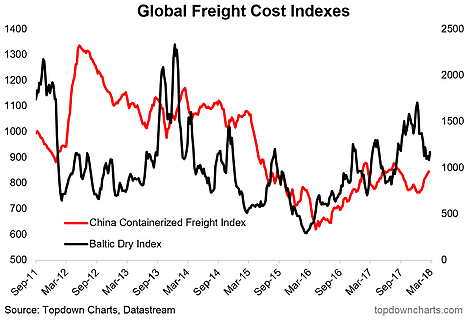
-The freight cost indexes confirm the recovery, and while more volatile lately, are yet to flag any downside risks, but remain key on our radar for the outlook here.
-Overall our base case is for another solid year in global trade growth, although some of the key tailwinds are starting to look tired.
1. Global Trade Growth: The CPB Global Trade Monitor showed global import volumes up 4.5% YoY in December 2017 (compares to 2.6% in Dec 2016 and 1.2% in Dec 2015). This acceleration in trade growth has been matched by improvement industrial production growth, up 3.9% YoY in Dec (3.2% in Dec 2016, 0.6% in Dec 2015). There has been a clear turnaround here vs 2015/16.

2. Global Container Throughput: The RWI/ISL Global Container Throughput Index, which offers a slightly more timely view on global trade activity, in the January data showed further acceleration and volumes running distinctly above trend. Basically by this data set it looks like global economic activity is moving beyond recovery to the maturing phase of the economic cycle.
3. Global Container Throughput: An even more timely view (the China Containerized Freight Index is weekly and the Baltic Dry Index is daily), the shipping cost indexes show a clear rebound from the 2016 doldrums, but have been a bit more volatile lately. We’re watching these indexes along with the PMIs for clues on the next steps in global trade. Our base case is another solid year in 2018 but some of the key tailwinds are looking tired.
Like what you see? Subscribe to our paid services for an extra level of insight and service.

