
Introduction
A FAST Graphs’ subscriber requested on our forum that I provide an analyze out loud video on Goodyear Tire & Rubber company. He stated that: “I thought the signs looked good, but few stocks seem to lose market value as consistently. The dilemma is to cut losses or if I thought it was a good buy before, maybe a great buy now down 30%?”
[timeless]
Q2 hedge fund letters, conference, scoops etc

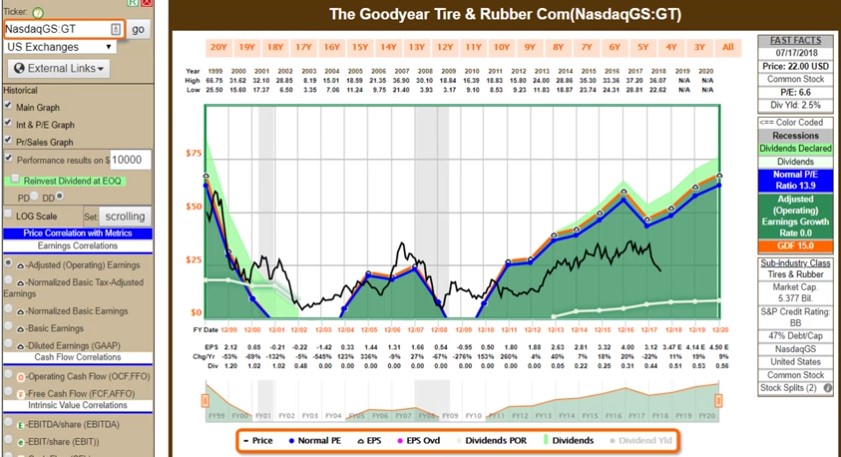
The request and the question and comment interested me because it provides an opportunity to evaluate a cyclical stock utilizing FAST Graphs. Consequently, let me start out by stating that FAST Graphs are designed to reveal a business’ fundamentals and how the market has historically valued those fundamentals. Therefore, we refer to FAST Graphs as a “tool to think with.” In this regard it is not offered as a short-term market timing tool. However, for the long-term investor, I do believe that FAST Graphs facilitates the making of sound and intelligent buy, sell or hold decisions as well or better than anything else available.
I hope everyone finds this useful,
Chuck Carnevale
Co-founder FAST Graphs
Article by F.A.S.T. Graphs

