
It has been almost one year since we initiated our first short position in Canada and made known our skepticism of the Canadian housing market (er, bubble) to our investors. Today we look upon the past year’s worth of data to see how things have progressed and examine the key metrics we follow to guide our views.
Q1 hedge fund letters, conference, scoops etc
Historically Elevated Unaffordability
Often, the most quoted statistic regarding the ongoing housing boom in Canada is Home Price to Income ratio, as shown in Exhibit 1. While we think this is a useful first visual for investors to recognize the existing bubble, it misses the more important point that borrowing costs declined far below the frothiest period of the American housing bubble. And so, instead, we prefer to focus on Exhibit 2, which shows the median monthly payment by households relative to income, thus taking into account interest payments and the effect of recently rising rates.
Exhibit 1: Home Price to Income
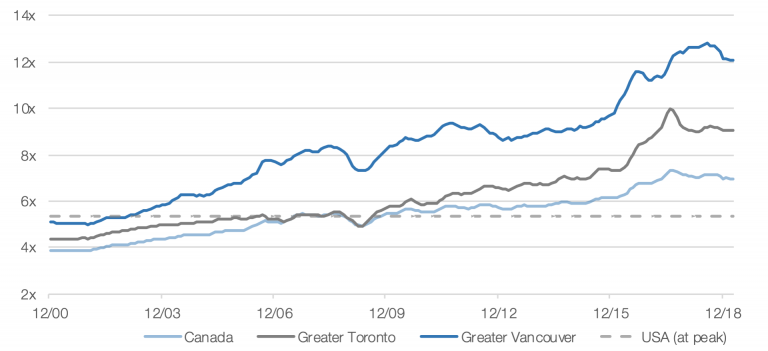
Sources: Statistics Canada, Teranet, CREA, GreenWood Calculations
And thus, with interest rates rising over the past 18 months, this affordability metric has suddenly converged towards the worst levels experienced since the last housing downturn in Canada. Our analysis was recently confirmed when we saw the RBC Home Ownership Poll which stated that “40% of Canadians say being ‘house poor’ is a reality,” meaning they spend more than 30% of their income on home ownership. This comes at one of the most difficult times for the fundamentals of the housing market in Canada, and as we’ll show later, Canadians have long been reaching into their savings to keep up their unsustainable lifestyles.
Exhibit 2: Median Monthly Payment as % of Income
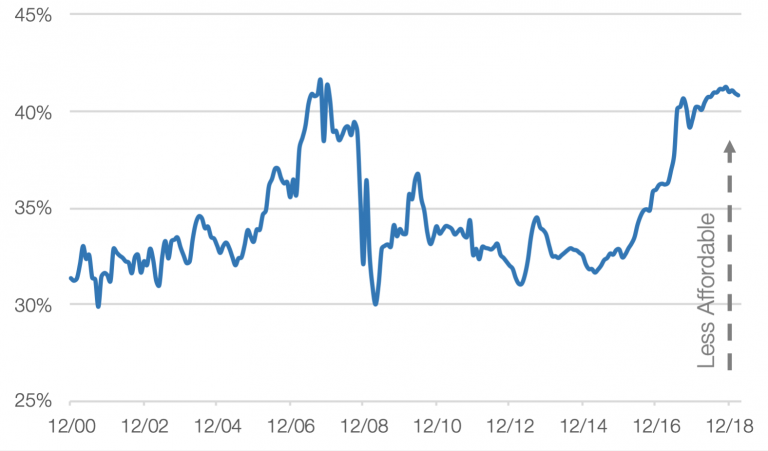
Sources: Statistics Canada, ratehub.ca, Teranet, CREA, GreenWood Calculations
The era of easy credit ushered in by the Federal Reserve spilled over to our friends up north as the Bank of Canada reduced rates to a sub 1.0% level through 2017 which allowed for homeowners to keep their monthly payments relatively low. We’ve noted previously that a precondition for us turning more negative on the Canadian housing market was The Bank of Canada starting its rate hike cycle, thus leading to more difficult conditions for homeowners. However, it appears that after increasing the overnight rate to 1.75% in October 2018, the BoC has placed further rate hikes on hold, noting in its March meeting that “Recent data suggest that the slowdown in the global economy has been more pronounced and widespread than the Bank had forecast in its January [meeting].” While falling posted rates (which ease the stress test) certainly would help, it doesn’t help as much as one would expect. For every 10 basis point reduction in rates, the average borrower’s buying power only expands by 1%.
Sales Volumes and Months of Inventory Continuing to Deteriorate
One the main concerns we noted last year, and the reason we believed the timing was particularly actionable, was the impact that the B-20 mortgage underwriting regulation changes would have on the housing market. It became apparent, starting in 2016, that the Canadian government was ready to tackle some of the concerns about affordability with foreign buyers taxes introduced in Vancouver and later Toronto. But the most significant impact on the market was the B-20 legislation that restricted mortgage availability through more stringent stress test qualifications. It is estimated to have cut out tens of billions of mortgage capacity from the market by cutting out up to 30% of the borrowers in the market.
Our expectation of the impact of such regulation was that we’d first see transaction volumes fall, and then prices soon thereafter. With recent headlines such as Metro Vancouver home sales in March hitting a three-decade low, you’d be excused to think that some sort of panic has set in. Truth be told, it does not yet feel this is the case for market participants, but we believe the more general market sentiment is now on the precipice as the media’s bias has clearly turned more negative.
Exhibit 3: Transaction Volumes, YoY %
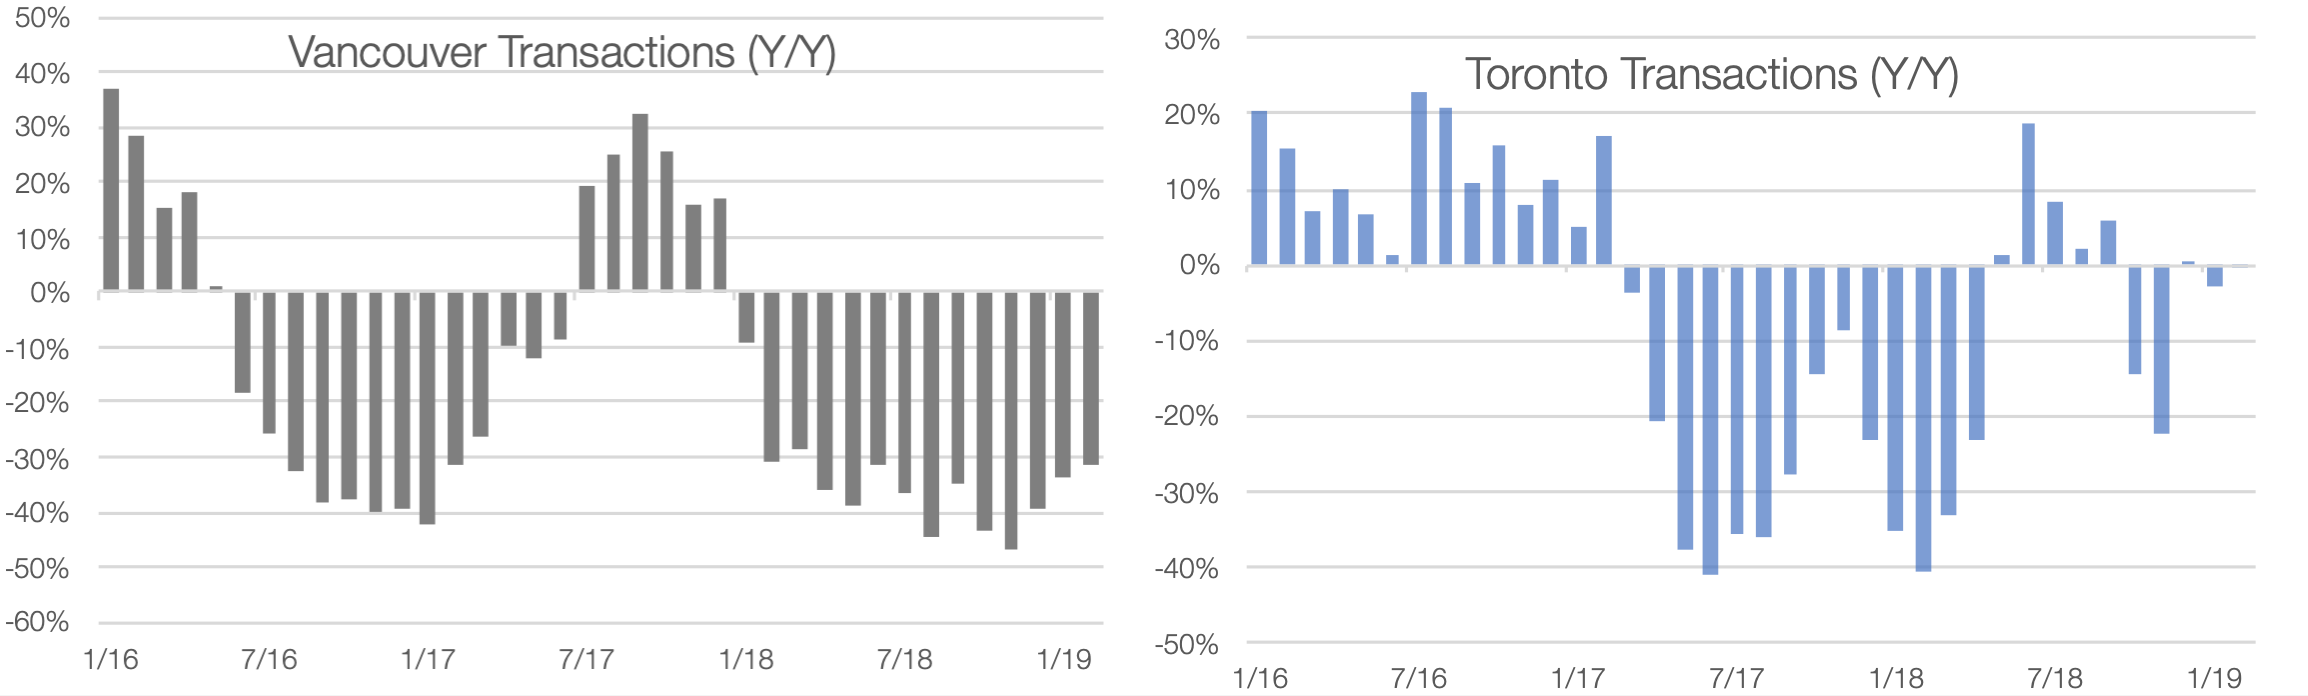
Source: Teranet
As Exhibit 3 shows, the significant weakening of buying capacity in the market has led to lower transaction volumes. However, the next leg of the thesis, lower pricing, is very slowly starting to show up in the overall price indices. The MLS Home Price Index (provided by CREA) registered a -0.47% year-over-year decline in the overall Canadian housing market in March 2019. But there remains a wide variability in pricing across regions in March: Greater Vancouver -7.7%, Calgary -4.9%, Saskatoon -2.7%, Greater Toronto +2.6%, Greater Montreal +6.3%. Part of the reason why some territories’ price indices have held up better than others is that the lower buying power has pushed a segment of the market down to condo purchases. This has the temporary effect of holding price indices up, while single family house prices are registering broad-based price declines. To give deeper context to this phenomenon, in the first quarter 2019, Toronto detached home prices fell -0.9%, while condo prices rose 5.9%. This mix shift has largely run its course as condo transaction volumes have turned negative, and just like the US experience in our last housing bubble, condo prices were the last segment to peak, and if the US example provides any guide, unfortunately it is due to fall harder as credit availability tightens at the bottom end of the market.
What has also been interesting to watch is the moderate uptick in new listings in the Greater Vancouver market, where March 2019 saw an increase of 11.2% year-over-year. When combining this with the deep sales volume declines, we see inventory (monthly supply of houses) trending up significantly. This has especially been the case in Vancouver, where in March, the inventory rate more than doubled from the same time a year ago. Local brokers are reporting homes sitting on the market longer and struggling to receive bids, far more than in the past. This is backed-up by a recent article in the Star Vancouver with the title, “Developer admits he’s ‘desperate’ as multimillion-dollar West Vancouver home prices tumble.”
Exhibit 4: Months of Inventory
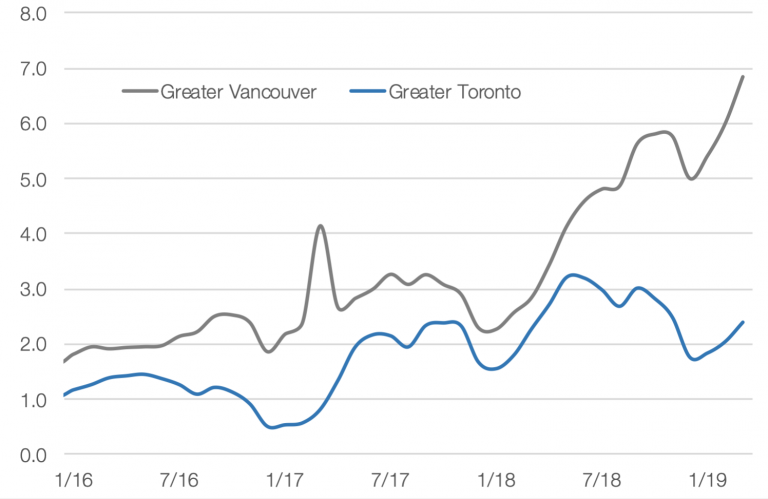
Sources: Greater Vancouver Real Estate Board, Toronto Real Estate Board
And these sizable inventory levels come at a time when there is record supply of housing under construction in Canada. As shown in Exhibit 5, British Columbia is about to have an onslaught of new supply hitting the market in the next 12 to 18 months, while Ontario sits at roughly a 30% premium to its historical average.
Exhibit 5: Housing Under Construction, Per 1k people
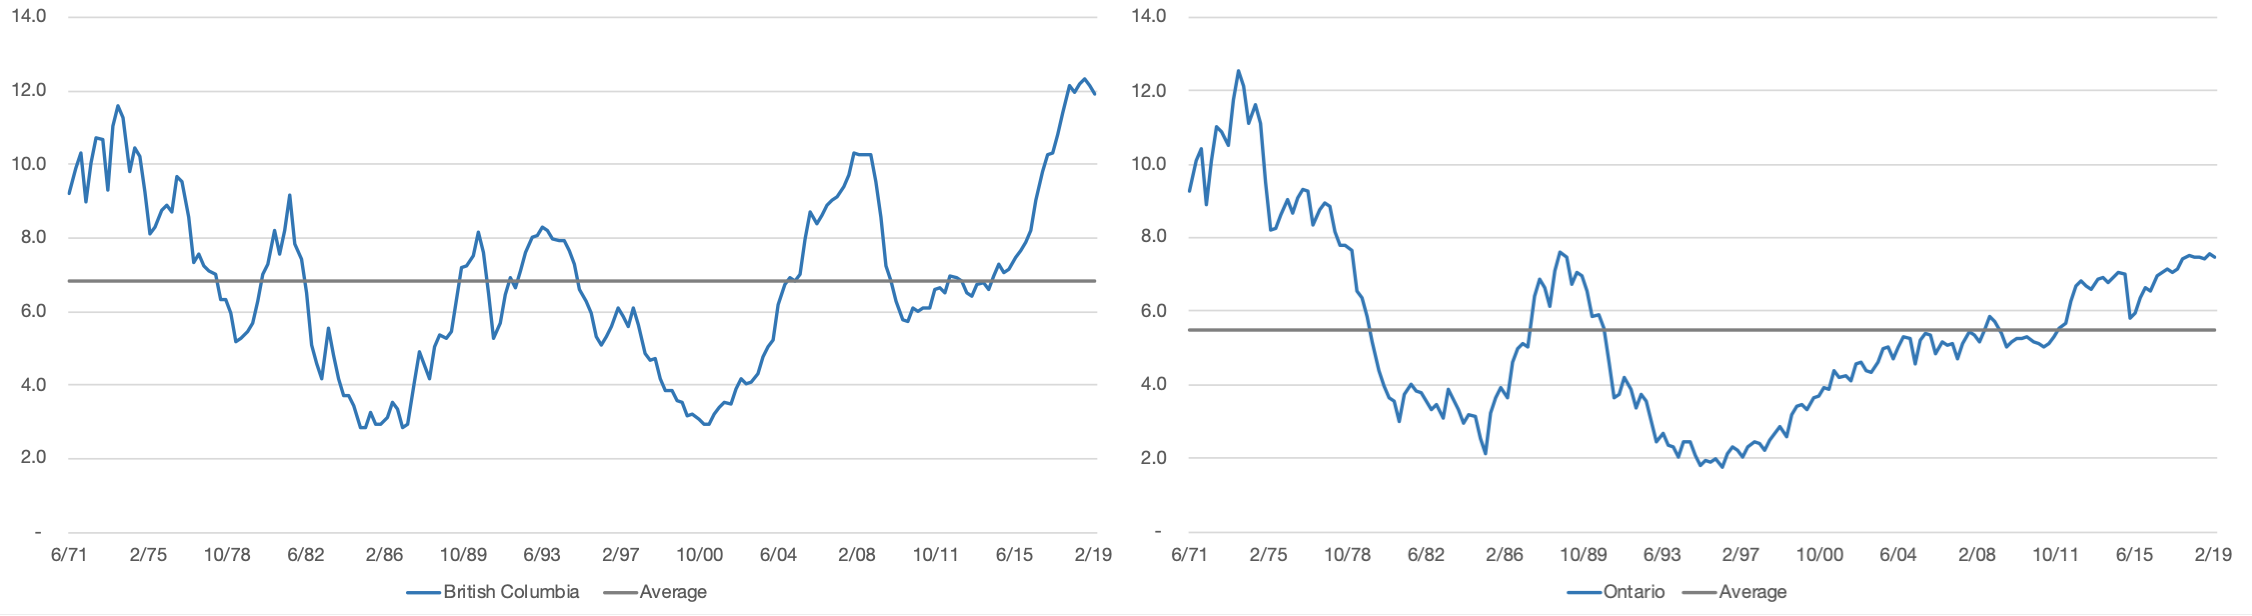
Source: Statistics Canada
Households Beginning to see a Slowdown in Credit
As we can see in Exhibit 6, Canadian mortgage creation has been slowing dramatically in recent months and sits far below the long-term average of 10% annual growth. This is a cause for concern as it is a leading indicator in the business cycle. In looking back over the period to 1970, only once before have we seen actual mortgage credit contraction.
Exhibit 6: Residential Mortgage Credit, YoY %
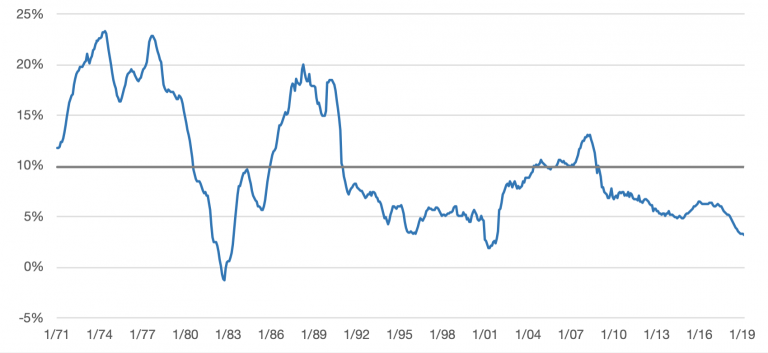
Source: Bank of Canada
Even with slowing mortgage credit growth, leading to a heightened risk of a ‘credit crunch’, and the Bank of Canada backed into a corner with an inability to cut rates to spur mortgage growth, we were still caught by surprise when the Bank of Canada made the announcement in November 2018 that it would begin purchasing mortgage bonds for the first time ever (with an initial purchase of $250 million in December 2018). While the official narrative from the Bank of Canada is that this is just part of “regular maintenance of their balance sheet”, the timing of the announcement is interesting. It would be naive to think the Bank of Canada is unaware of the elevated risks in the Canadian housing market and the significant indebtedness of its citizens. As we start to see more market volatility (price declines in Vancouver, continued weakness in Alberta, etc.) and the credit markets begin to demand higher risk premiums, we may well see spreads widen on mortgage bonds (and similar securities) which are used as bank funding. This leads to higher borrowing costs to banks which then trickles down to 1) higher consumer lending rates or 2) tighter lending standards. We can then infer that the Bank of Canada is possibly front running the inevitability of having to purchase sizable quantities of mortgage bonds in the future in order to maintain liquidity in the market and ensure borrowing costs don’t rise too aggressively.
And as another confirmatory datapoint that the future path for household credit is likely lower, just this week we received the Bank of Canada’s “Senior Loan Officers Survey” for the first quarter, with the report specifically stating, “Demand for household borrowing is expected to continue to decrease next quarter, driven mainly by low-ratio mortgages and home equity lines of credit. Lower housing market activity, uncertainty over rising interest rates, and a potential slowdown in the Canadian economy were the main reasons given.”
It should be noted that the rate of mortgage credit growth is generally taken as an indicator to the health of the overall economy. With that growth slowing, it is somewhat concerning that the first quarter Business Outlook Survey conducted by the Bank of Canada showed the weakest quarter-over-quarter rating since 2008.
Exhibit 7: Business Outlook Survey
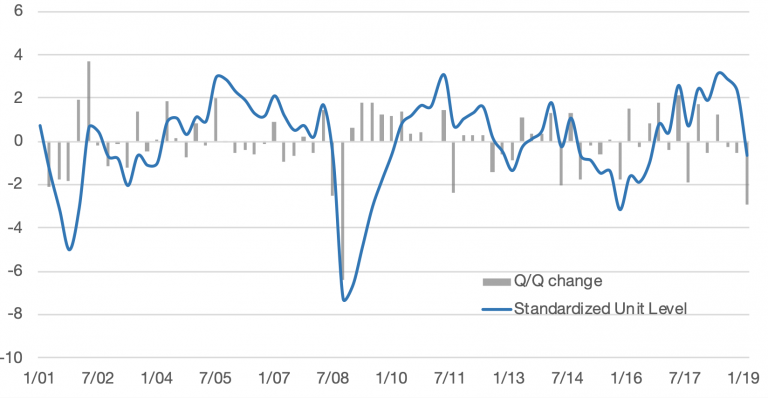
Source: Bank of Canada
Households Ill-prepared for a Downturn
All of this comes at a time of historically low savings rates by Canadians. As shown in Exhibit 8, the current household savings rate in Canada sits at only 1.1%, which is 86% below the long-term average. What this implies is that the average Canadian household has basically no ability to absorb any personal financial shock – wether that is losing a job, filing for divorce, falling ill, or simply needing to ‘fix up’ one’s home.
Exhibit 8: Household Savings Rate
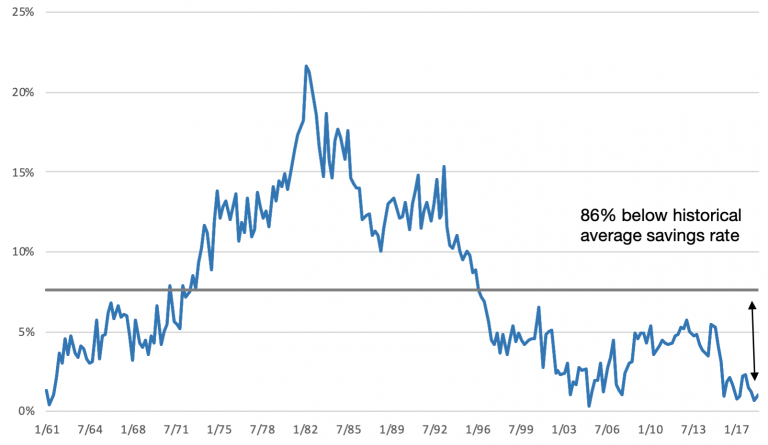
Source: Statistics Canada
Ultimately, this lack of savings will lead to heartbreak in the form of consumer insolvency. As shown in Exhibit 9, Canadians are filing insolvency proposals at the highest rate since the Global Financial Crisis. While it may look like a nominally low year-over-year growth rate of only 4.2%, we should remember that this is occurring during a period where interest rates are at historical lows and the global economy is showing positive growth. While we don’t know exactly when the next Canadian recession will arrive, we can be quite certain that consumer insolvencies will be trending much higher into that period.
Exhibit 9: Canadian Consumer Insolvencies, Trailing Twelve Months
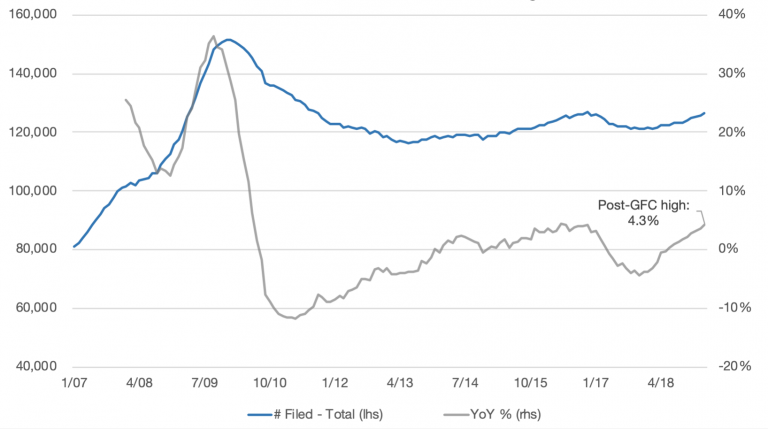
Source: Office of the Superintendent of Bankruptcy Canada
We see the expectations gap on this trade as still quite wide, though there has been more rumblings of US investors taking aim, once again, at shorting the Canadian housing market and its banking system. One of those becoming more public with his opinion is Steve Eisman. You can watch his recent interview on BNN, but the comment that resonated with us is, “I don’t think there’s a Canadian bank CEO that knows what a credit cycle really looks like. I just think, psychologically, they’re extremely ill-prepared.”
We believe the 2019 Summer selling season will be the proverbial ‘Red Line’ to determining if market psychology takes prices lower. What we do know, is that most of the underlying data is flashing red, yet the TSX Composite is reaching all-time highs.
Article by GreenWood Investors

